Autosomal DNA – Digging Deeper
10 February 2019
History Branch & Archives
833 N. Ocoee
Cleveland, TN 37311
Link to other presentations HERE
Updated 03/22/2020
Look for the symbol:

Slide 01
This presentation is the third in a series of presentations that I have been asked to give for the Cleveland TN, Historical Library. I’d like to thank Margot Still for allowing me to do these.
The second presentation introduces basic autosomal DNA concepts and this one pics up on what was covered there and looks at tools to help us make sense of the comparison results.
Slide 02
So what is this presentation all about? The focus this month is to quickly review how autosomal DNA works and to use various tools to help us understand what ancestors provided us with parts of our DNA.
My professional background is 26+ years of computer training, course development, consulting, and I have a few published computer technology related books that I have worked on. I have taught over 350 different classes in my career. I primarily now teach companies on how to build a cloud and use virtualization to extend their data center capabilities.
I have 45+ years of genealogy experience with the past 33 years using computer software to aid in my research. I have been on Ancestry.com since 2007.
Slide 03
Genetic genealogy is the use of comparing your DNA results to someone else’s results to determine the genetic relationship between you and them. We will see that if you have no common DNA it doesn’t necessarily mean you are not related. But common DNA does mean that you have a genetic relationship with that individual.
Slide 04
In 1857 Gregor Mendel performed an experiment with plants that led to increased interest in the study of genetics. This eventually led to the study of human genetics.
For more info on the History of Genetic Research go HERE.
DNA is a complex topic. For the purpose of this presentation I will focus on the basics.
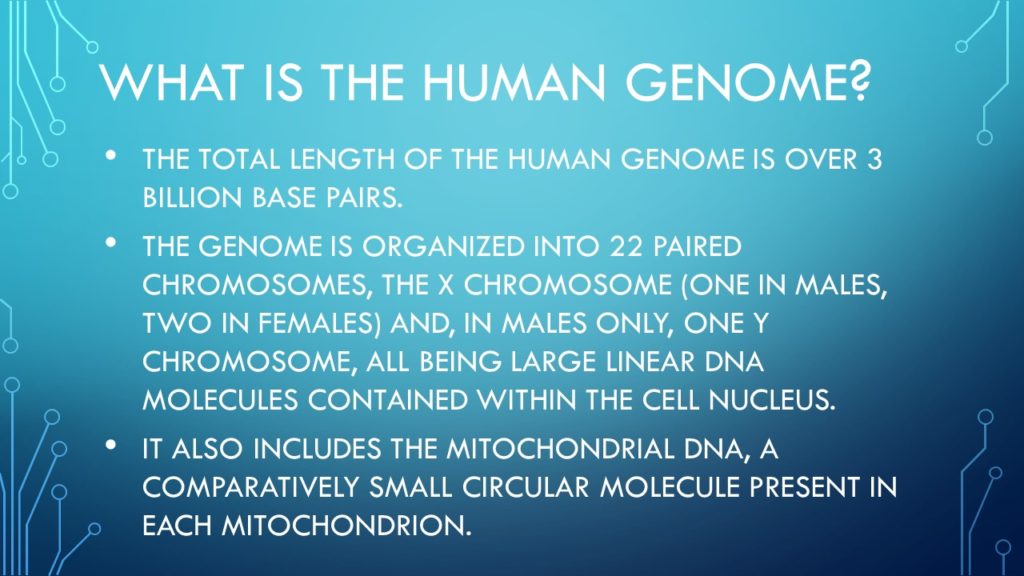
We get our DNA from our parents who got it from their parents and so on. Autosomal DNA [which is the focus of this presentation] comes only from the first 22 Chromosomes. We reference the segments in multiple ways. One way is by base pairs. Each Chromosome starts with Base Pair 1 and ends on its last Base Pair. All Chromosomes have a different number of Base Pairs. A smaller part of each Chromosome can be defined by a starting Base Pair number and an ending Base Pair number.
Slide 05
A good video to dive deeper into the Human Genome is located HERE.
Slide 06
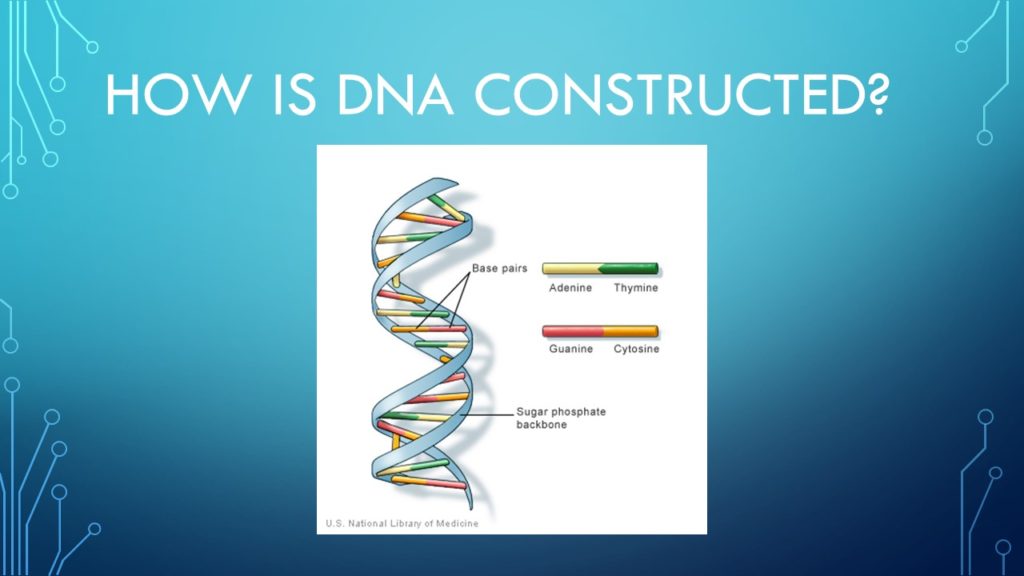
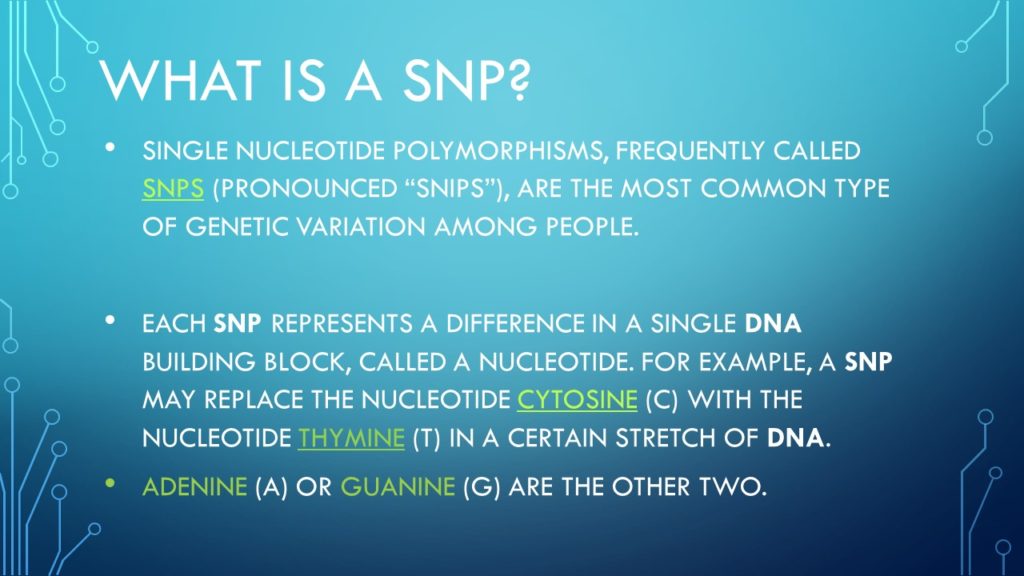
The DNA chain is made up of Base Pairs of combinations of four different Nucleotides.
A more technical presentation is located HERE.
[Aren’t you glad I didn’t go this deep???]
Slide 07
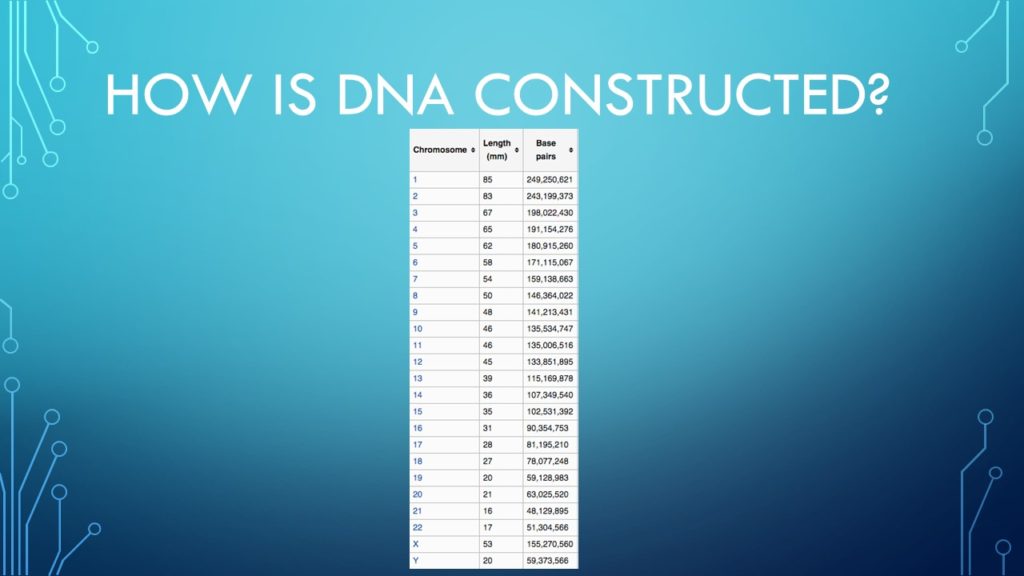
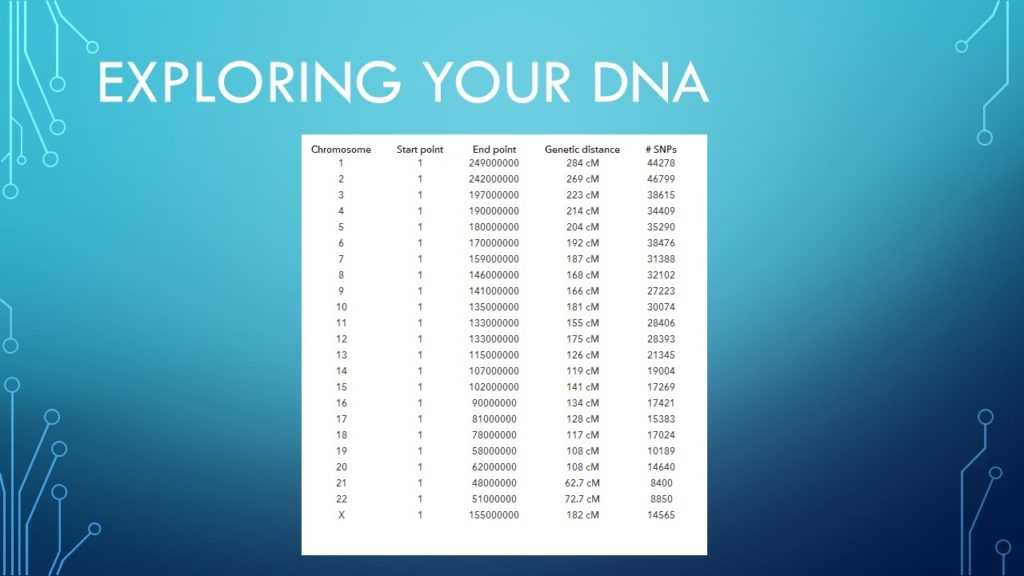
Each Chromosome starts with Base Pair 1 and ends with its last Base Pair. In this slide we can see that each chromosome has a different number of Base Pairs. A portion of that chromosome is referred to as a segment. We can identify it’s location by what chromosome it is on and it’s starting and ending base pair.
For example Chr. 6: Base Pairs 36,284,111 – 79,993,211
This is one way we can refer to a specific segment.
Slide 08

If we would examine our Chromosome 6 we will see that it is composed of a specific number of Base Pairs.
Slide 09
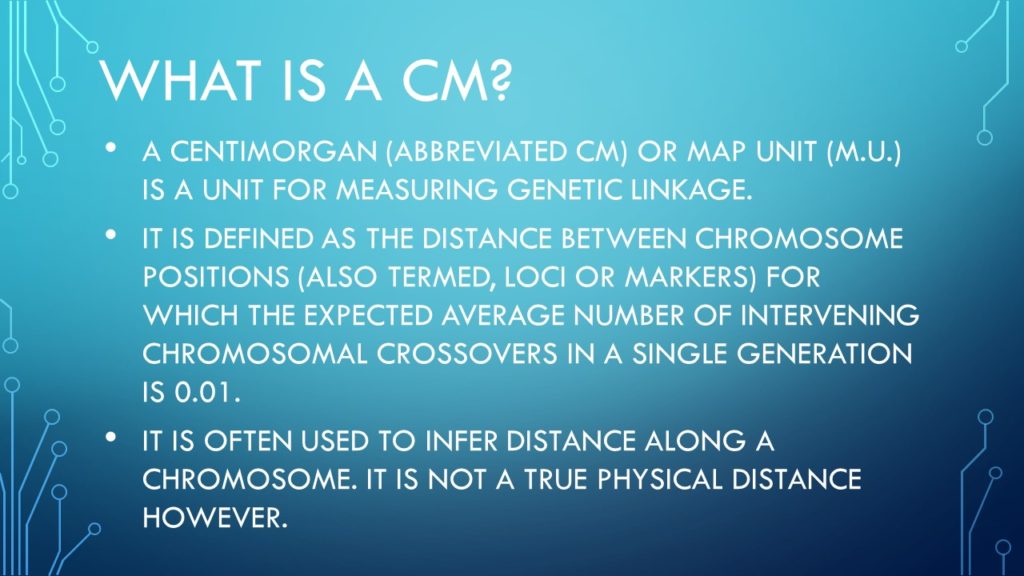
Another way to reference a specific segment is by the chromosome it is on and by its centimorgans.
Slide 10
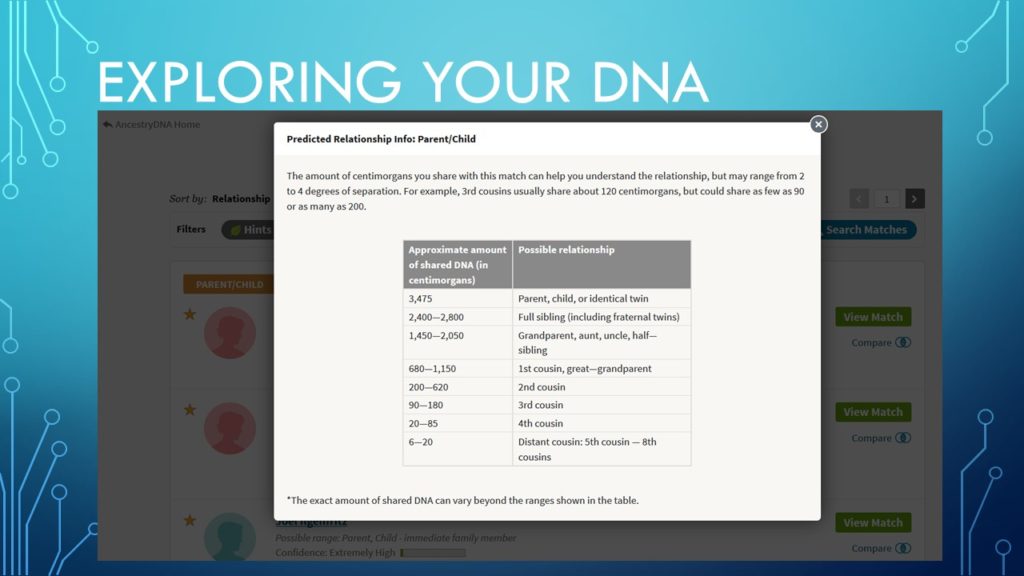
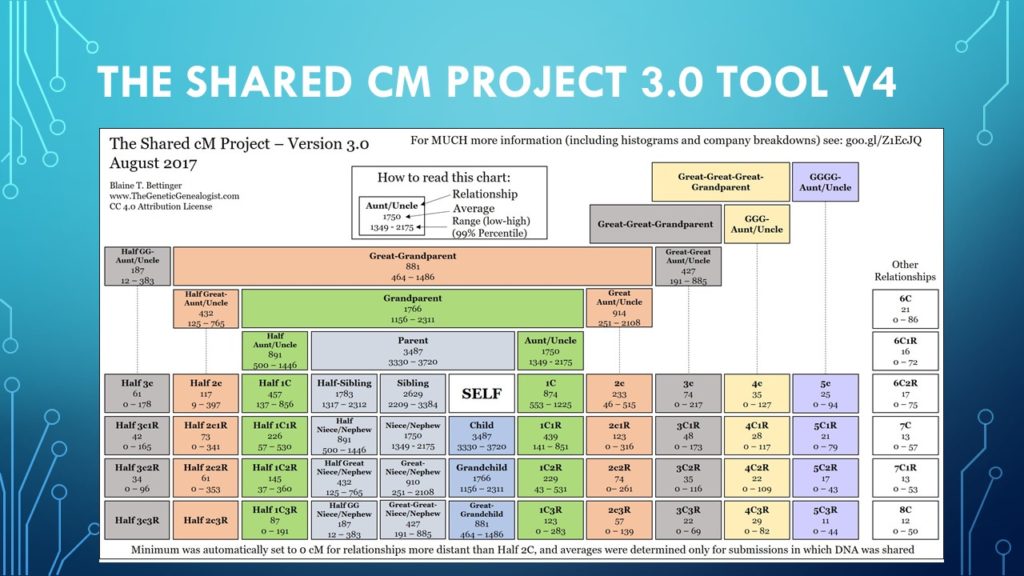
When comparing your autosomal DNA to someone else’s, you might see that the software you are using tells you that you have a certain number of segments in common with that person. Each segment will be a certain number of centimorgans [abbreviated as cM]. The total amount of common DNA can help determine how you are related to that person.
Notice that the top of the chart in this slide that the highest number represents only 3 possibilities: that the person you are comparing DNA with can only be either a parent, child or identical twin. Obviously if that person is older than you they would be your parent, younger than you they would be your child and having the same birthday your identical twin.
As will look lower in the chart we see that the number of cMs gets lower and the relationships get further apart. This chart [and others like it] are a guide to help us approximate how distant the relative is from us. Be aware that you could have 0 cMs in common and still be related. We will understand how that can be possible later in the presentation.
Slide 11
This chart shows the 3 ways we identify segments in autosomal DNA: Base Pairs, cM and SNP’s.
Slide 12
There is a free self paced online course available called: Introduction to Biology – The Secret of Life
To learn more click HERE.
Slide 13

From the previous chart we could summarize Chromosome 6 as a certain number of Base Pairs, SNPs or cMs. The numbers are different per chromosome. Your Chromosome 6 was constructed at the moment of conception using DNA from your parents. The process that does this is called recombination.
Slide 14
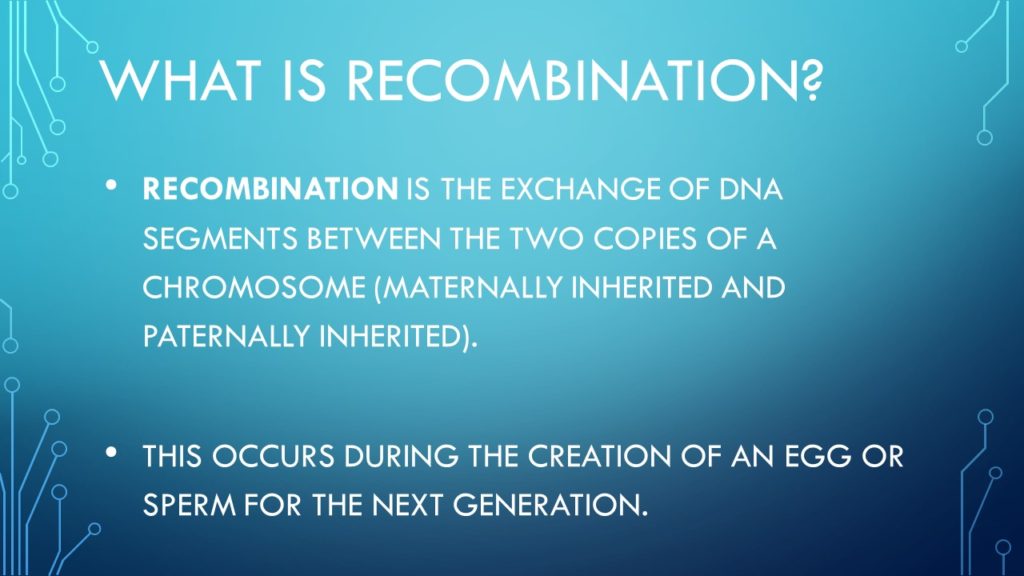
Recombination allows for genetic variations from generation to generation.
Slide 15
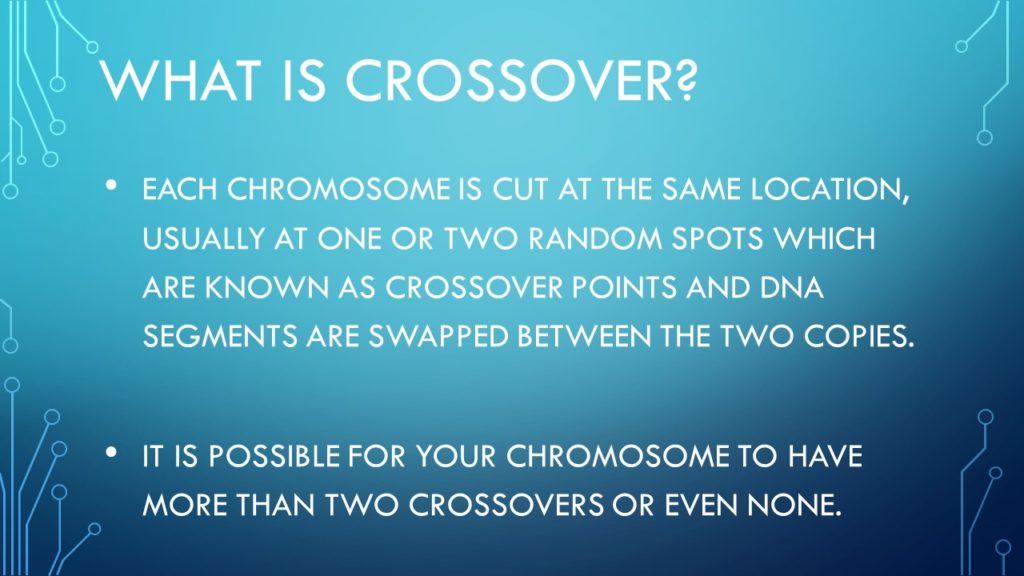
For more info on crossover click HERE.
Slide 16
Autosomal DNA is similar to going fishing with a large net. With a large net you will catch all kinds of fish in it.And you can catch a lot of fish with it.
Autosomal DNA allows you to “catch” relatives from all parts of your family. It also can provide you with THOUSANDS of new relatives.
It is an excellent test to find people that have a common ancestor related to you within the past 5 to maybe up to 7 generations ago.
Autosomal DNA tests the part of your DNA that recombines between parents every generation.
Slide 17
There are many testing companies that off autosomal DNA testing.
Be aware however that will autosomal DNA can tell you that you are RELATED to someone. It won’t tell you how. The greater the number of cMs, the closer you are related to that person.
You must use traditional genealogy to help you determine HOW you are related to the relative.
Also remember that it is possible that you share no common autosomal DNA with someone and yet you are related to them. This is caused by recombination. With each generation we lose genetic information from ancestors.
Slide 18

So lets review how your DNA came from your ancestors!
Slide 19
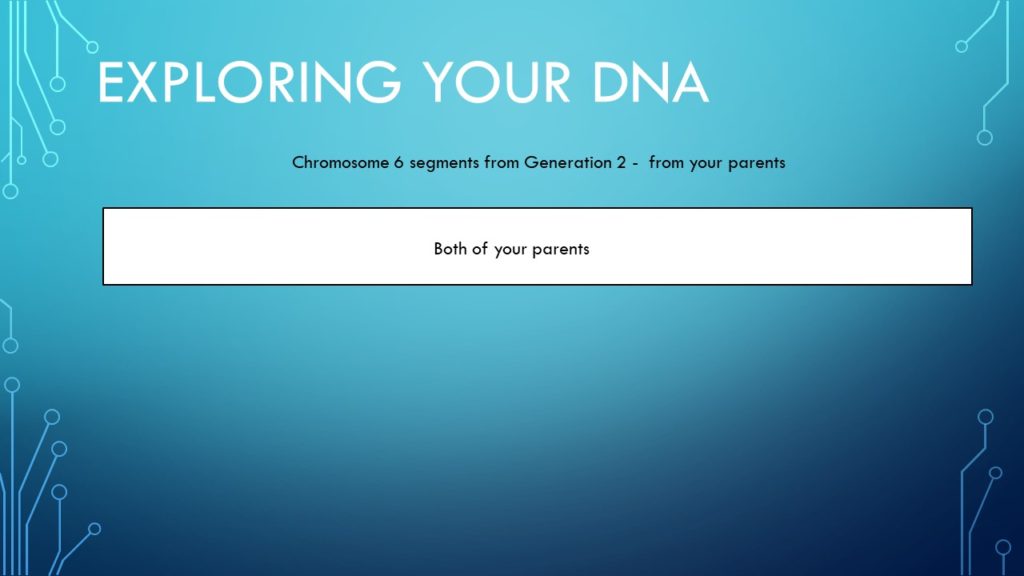
So let’s look at one of your parents Chromosome 6.
Slide 20
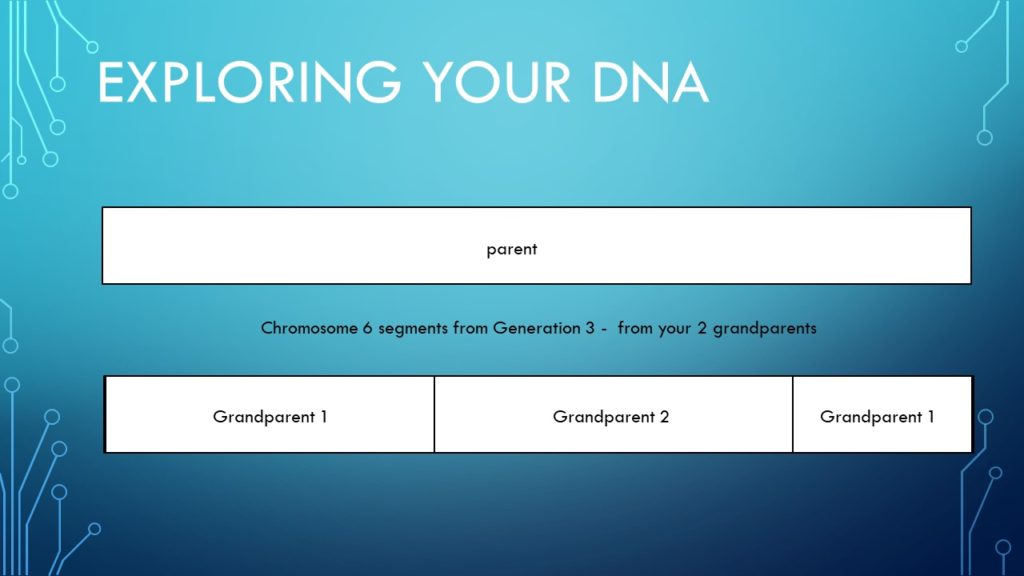
Your parent got their Chromosome 6 from their parents. Let’s say this is your mother’s Chromosome 6.
This slide shows that the first segment came from their father, the second segment from her mother and the third segment from her father.
The line between them represents a crossover point. Each segment can be defined by a starting and ending Base Pair. Each segment also can be defined by a certain number or cMs or SNPs.
Slide 21
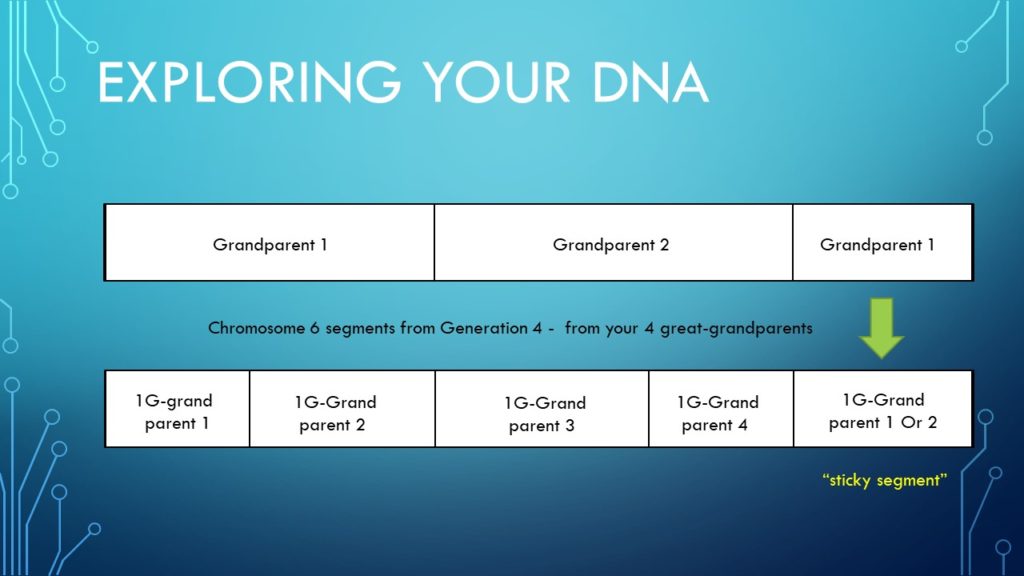
Looking back another generation we could see that your mother’s first segment from her father [referenced as your Grandparent 1 – which would be your mother’s dad] got his DNA for that segment from his parents.
Slide 22
If we were able to determine which of your ancestors contributed their Base Pairs to you, as we went further back we would see which segments came from each ancestor.
Slide 23

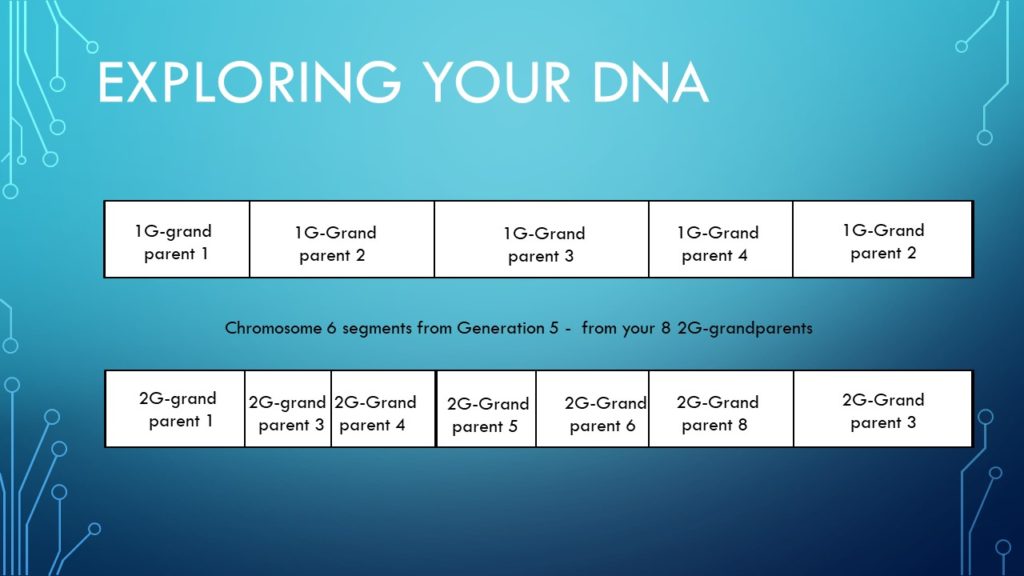
As you can see the previous crossover point boundaries carry to the next generation because the previous generations segments provide the DNA for the next generation.
Notice that over time the contributed DNA from ancestors is lost due to recombination. That explains why autosomal DNA can only go back so far. However there are other tests that can help with deeper more distant searches. I will cover them in later presentations.
Slide 24
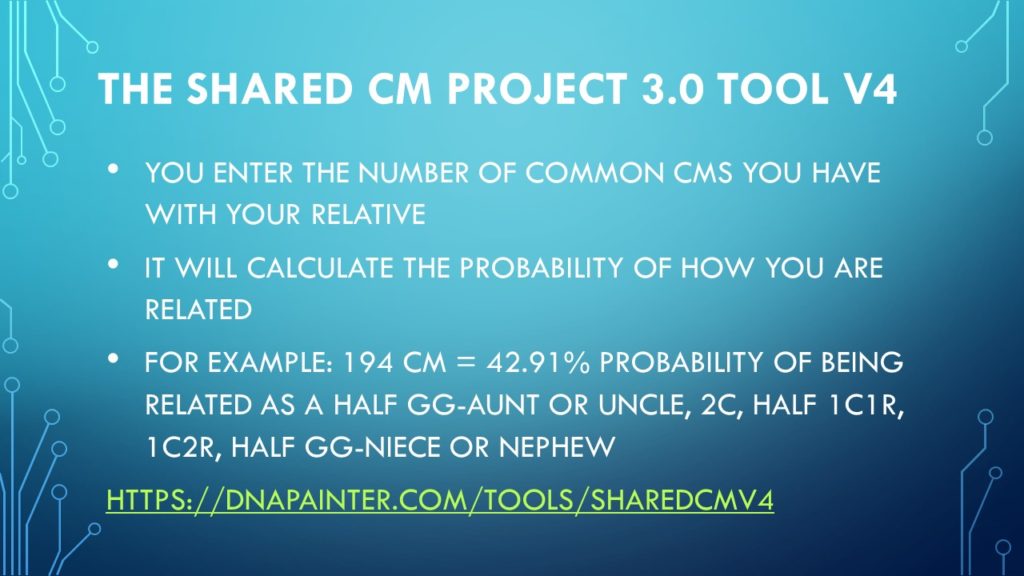
The link to the tool is: https://dnapainter.com/tools/sharedcmv4
Slide 25
When comparing Autosomal DNA test results to someone else this is a good place to go if you are not sure how closely you are related.
The Shared cM Project 3.0 tool v4 – https://dnapainter.com/tools/sharedcmv4
This chart helps us determine what possible relationships we could have with a person. Let’s say you have a relative that you have 215 cMs in common. This chart shows that you could be a number of possible relationships based on that number. We can use that information to help us determine how many generations ago our MRCA lived. These numbers are based on observed numbers of known relatives. Notice that even with 0 common cMs you could still be related a number of different ways. The first number is the average for that type of relationship.
The tool allows you to enter the number of total cMs you have in common with the person you are comparing tests with and will tell you what type of relations will be possible. For instance if we enter 215 we will see this:
Relationship probabilities (based on stats from The DNA Geek)
- 49.29%Half GG-Aunt / Uncle 2C Half 1C1R 1C2R Half GG-Niece / Nephew
- 39.88%Half 2C 2C1R Half 1C2R 1C3R
- 6.04%Great-Great-Aunt / Uncle Half Great-Aunt / Uncle Half 1C 1C1R Half Great-Niece / Nephew Great-Great-Niece / Nephew
- 4.79%Half 1C3R † 3C Half 2C1R 2C2R
- ~ 0%** Half 2C2R
** this set of relationships is just within the threshold for 215cM, but has a zero probability in thednageek’s table of probabilities
† this relationship has a positive probability for 215cM in thednageek’s table of probabilities, but falls outside the bounds of the recorded cM range (99th percentile)
So the most likely relationship between you and your relative is either:
- Half GG-Aunt or Uncle
- 2nd Cousin
- Half 1C1R
- 1C2R
- Half GG-Niece / Nephew
I have a 2nd cousin who shares 215 cMs. Now we know how we are related but if you didn’t this could help you narrow down the possibilities.
Slide 26
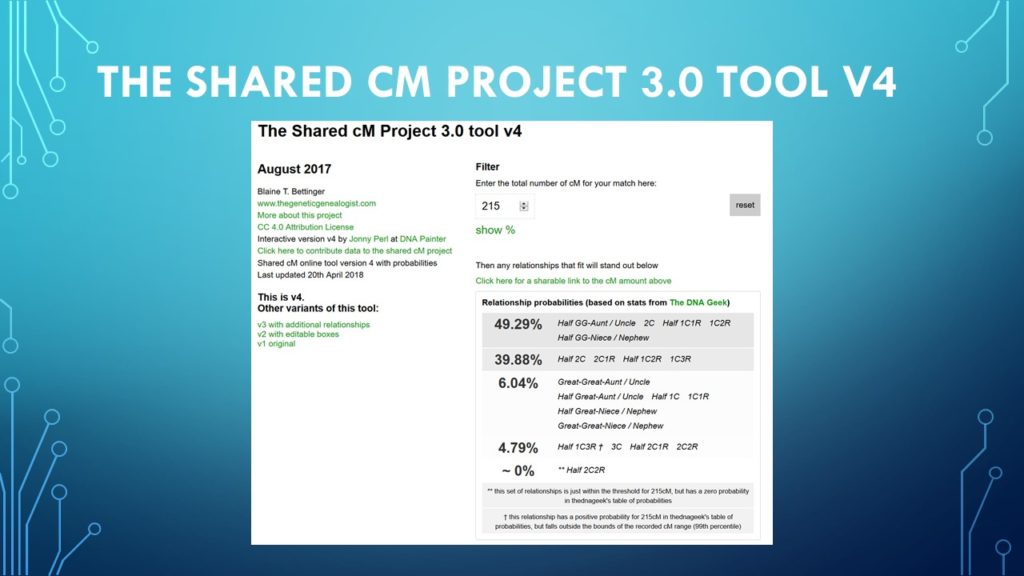
In this slide you can use the CM tool to show the highest probability based on the number you provide. I input 215 which is the amount of common DNA I have with a cousin of mine. You can see the percentages of how likely we are related in each of those ways.
Slide 27
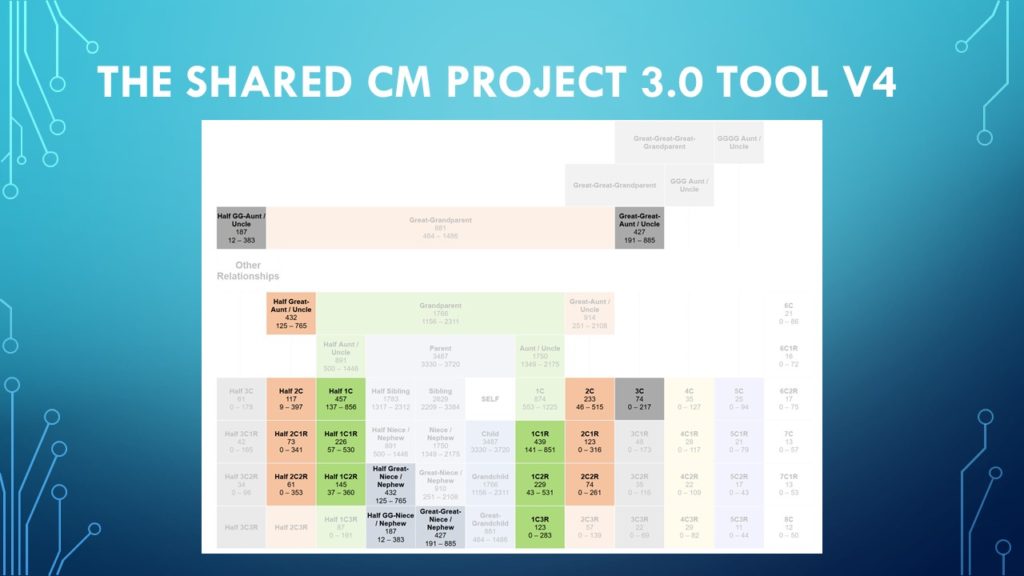
Scrolling down on the screen you will see the relationships that have that number as a possibility. Notice the other boxes are “ghosted” out so they shouldn’t be considered.
Slide 28
Another emerging tool we can use is called a Chromosome Browser. It allows us to determine where did each segment of our DNA come from. This is VERY useful when trying to determine how someone might be related to you.
Slide 29
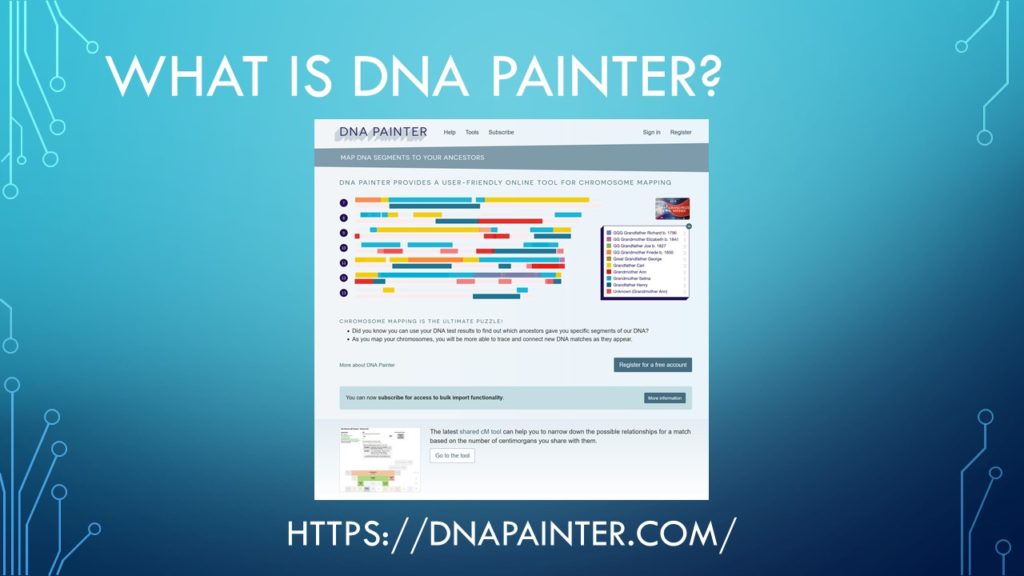
The link to the site is: https://DNAPAINTER.COM
Slide 30
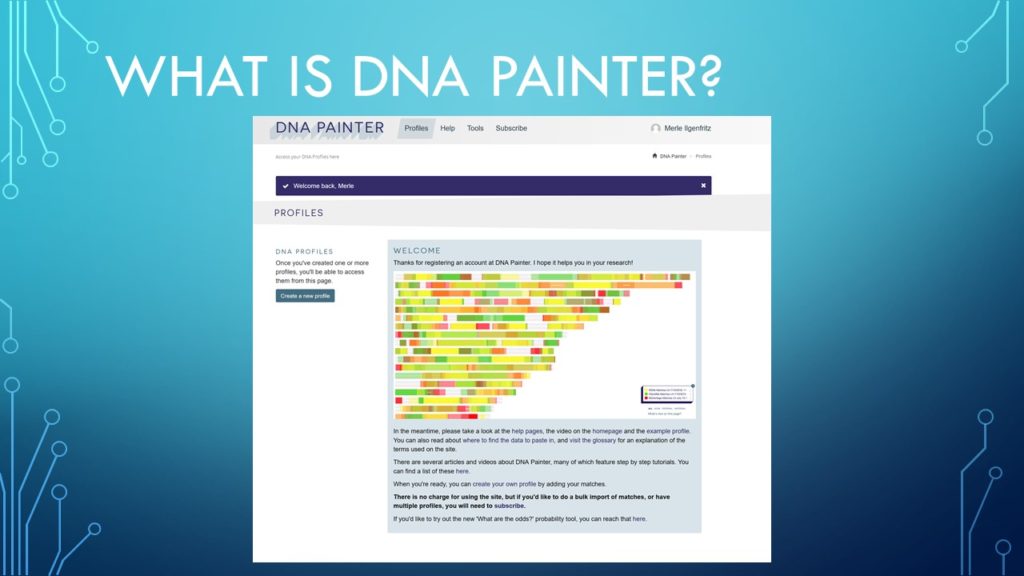
The DNA Painter site provides free access to a DNA Chromosome Browser tool. You must first create a free account before beginning to add your info.
Slide 31
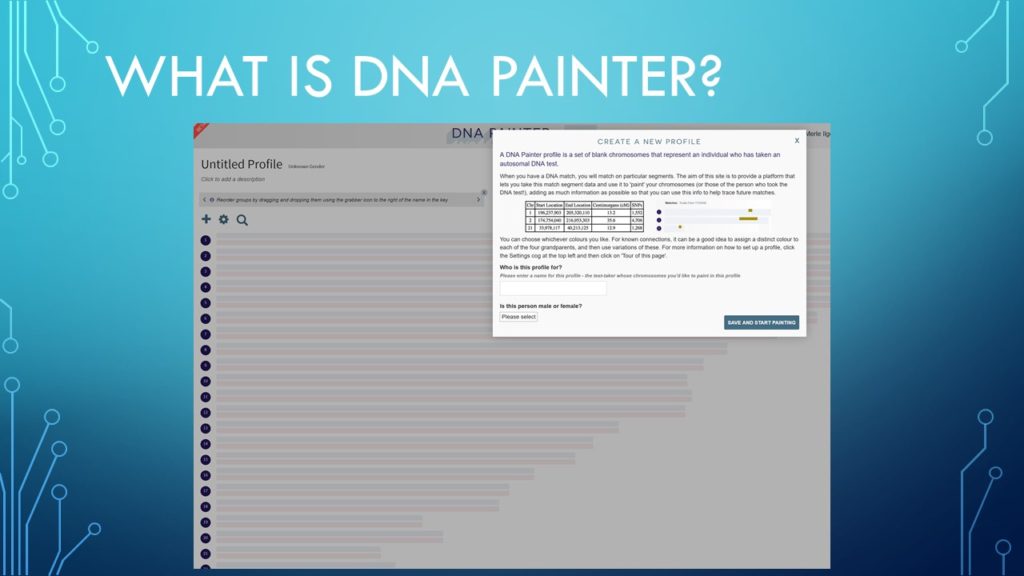
The first step is to create your profile. They give everyone one free profile. Which is enough for most users. Advanced users might want to make different profiles for different family lines. There is a yearly fee to add additional profiles. In order to add your DNA information from others that are related to you then you can either download that data from the supported DNA testing companies or use the gedmatch website.
Since Ancestry.com is not one of the supported companies I must use gedmatch.
Slide 32
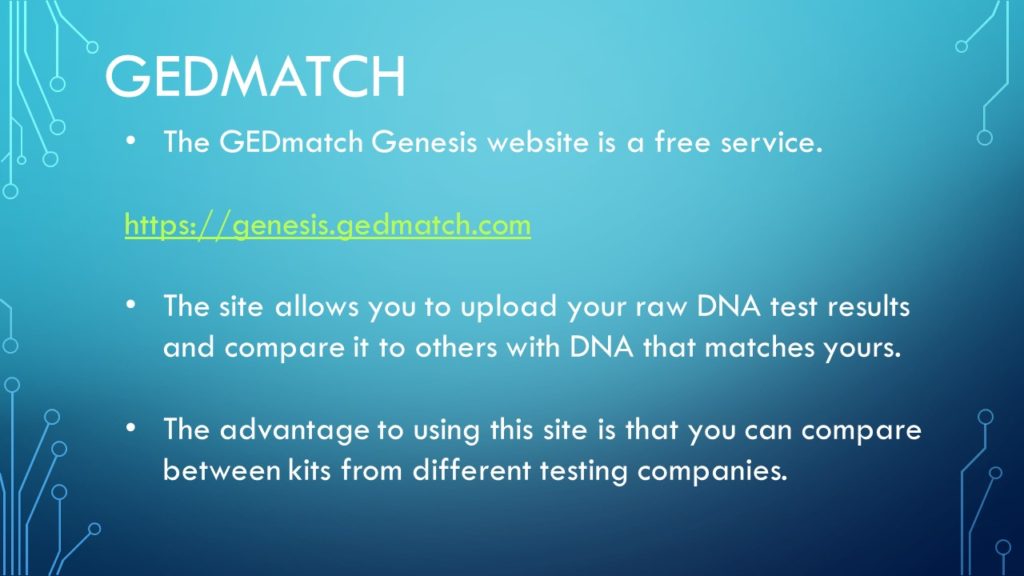
The link to the gedmatch site is HERE.
The more people you can compare your DNA to the more likely you will find matches. GEDMatch allows people from different testing companies to compare their DNA with each other.
Slide 33
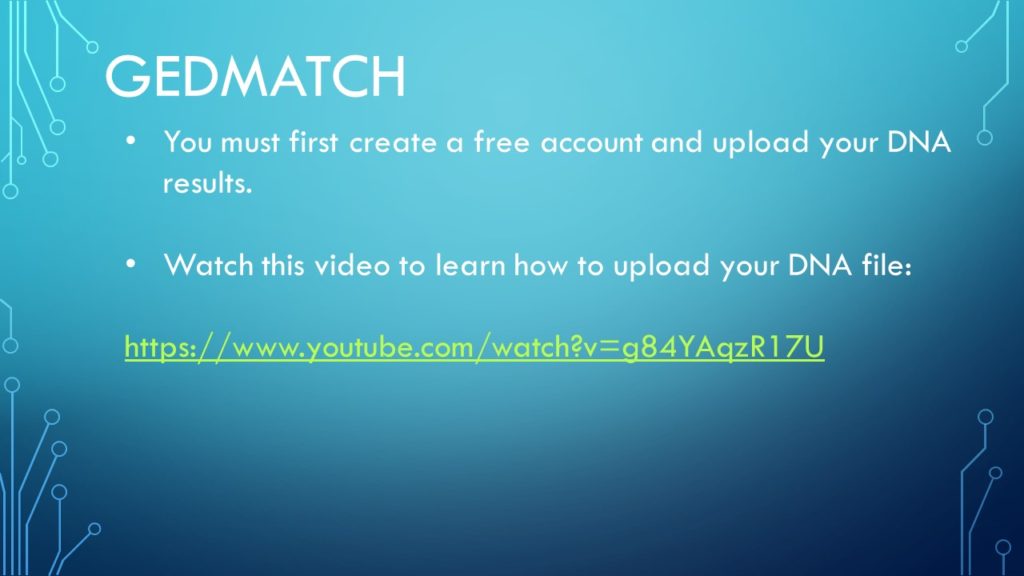
There are lots of additional things you can do on the GEDMatch site that I won’t be covering in this presentation.
Click HERE to watch the video with instructions on how to get your RAW DNA file from your testing company and how to upload it to the gedmatch site.
There are plenty of videos on youtube to teach you how to use the other tools on gedmatch.
I will do a presentation on the GEDMatch site in a future presentation.
Slide 34
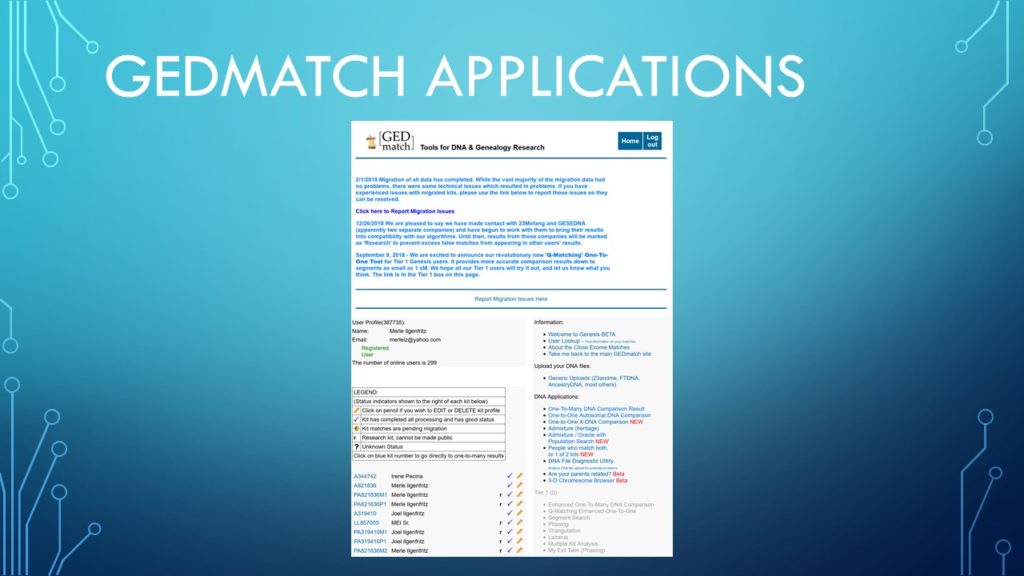
After you have created a free gedmatch account and uploaded your RAW DNA file it takes about a day to process it against all of the other files they have collected. You can also add other relatives DNA under your account if you have access to it.
Slide 35
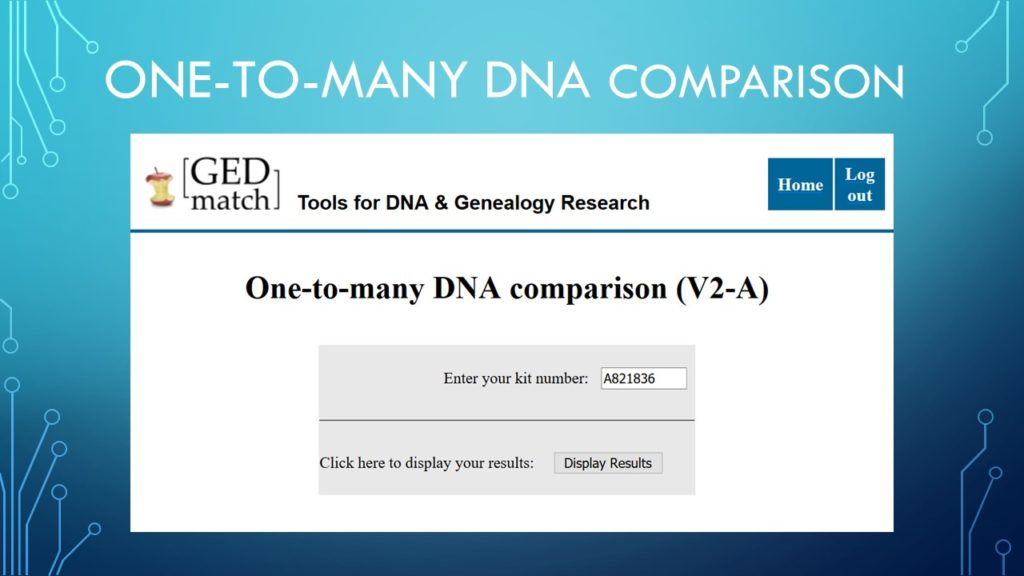
One of the main tools on the gedmatch site is the one to many comparison tool. You will see a link for it in the middle-right of the gedmatch homepage. When you click on it you will get the screen shown in the slide. Put in your gedmatch ID number. [If you forget it look on the gedmatch homepage]. The click Display Results.
Slide 36
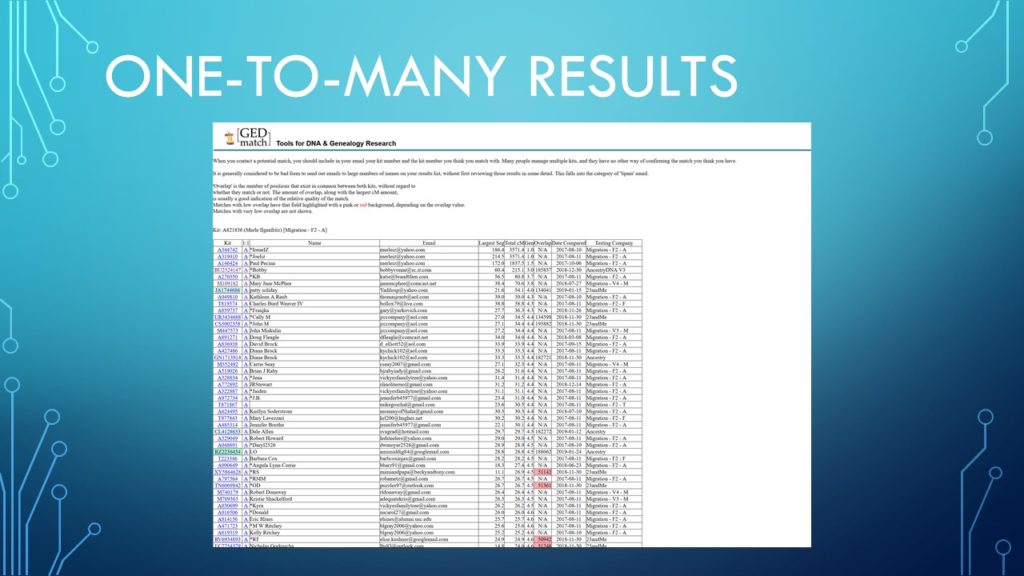
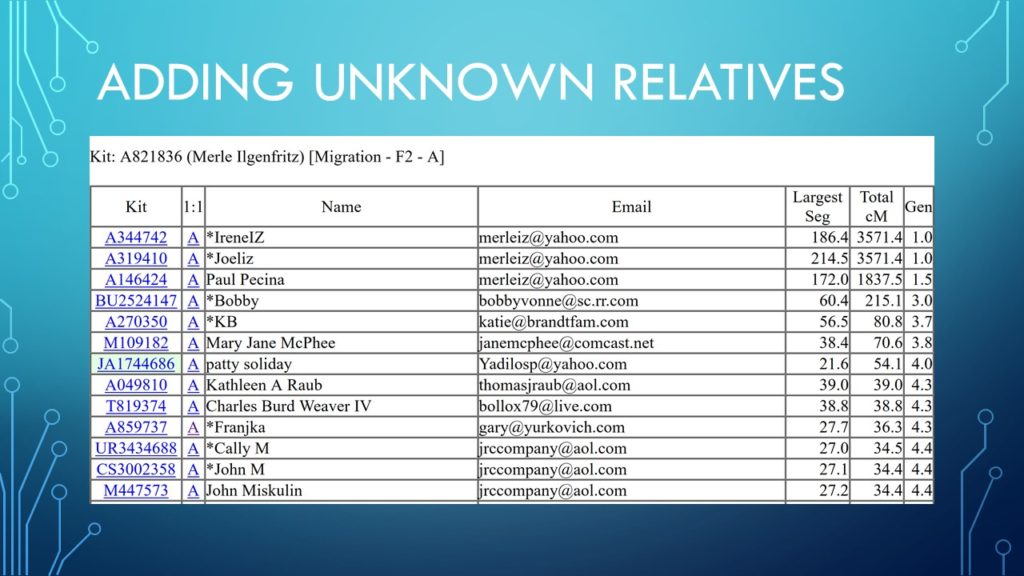
When you uploaded your RAW DNA data gedmatch tested it against every sample that has been previously uploaded and built you a list starting with your closes relative based on the highest number of common cMs.
The first field is the gedmatch ID # of the relative. If you click on it then you will see their one-to-many results list.
The second field is the 1:1 field. This is a shortcut to do a one to one test with that relative. [We will discuss this on the next slide]
The third field is the Name field. Most people don’t submit their real name.
The fourth field is their email address. I would recommend contacting that person to start a dialogue and let them know you are trying to connect. Also to see if they have a tree so you could compare possible ancestor connections.
The fifth field is shows what the largest segment is in cMs.
The sixth field shows the total amount of shared DNA with the relative. [I will cover the remaining fields in an upcoming presention on all of the GEDMatch tools.]
Click on the 1:1 link of the person highest in the list that:
- Is not an immediate member of your family
- You know who they are
- You know how you are related to them
Slide 37
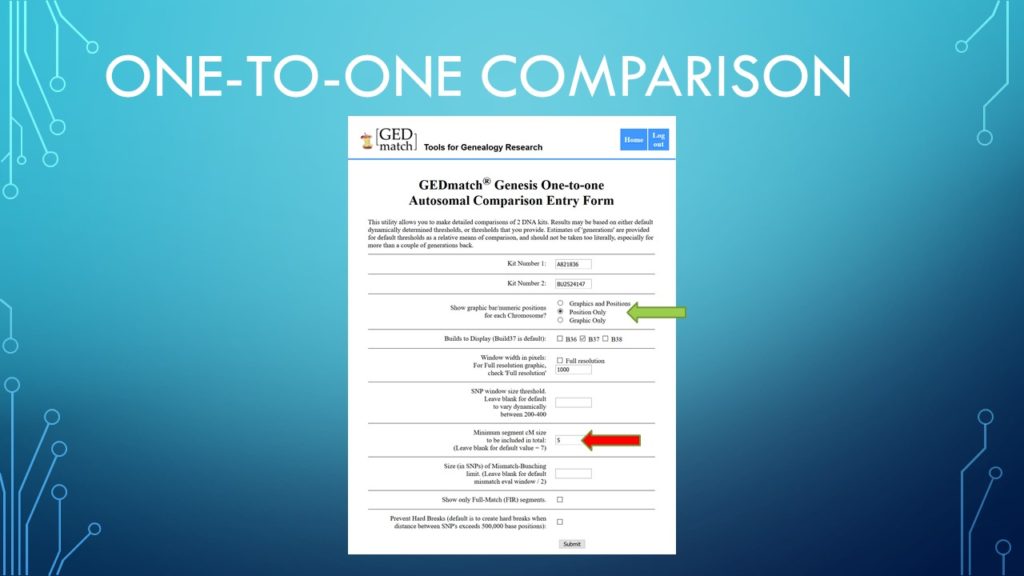
When you click on the second field you go to the One-to-one comparison. This is the report we need for our DNA Painter!
I have selected my 2nd cousin.
Be sure to click on the Position Only radio button. [left of the green arrow] DNA Painter does not need the graphics that gedmatch will make.
Also decide how small of a segment you should choose. 7 cM is generally thought to be a small as we should go. Anything smaller might be garbage data. I am selecting 5 cM here to show you what this could change with the output.
Click on the Submit button.
Slide 38
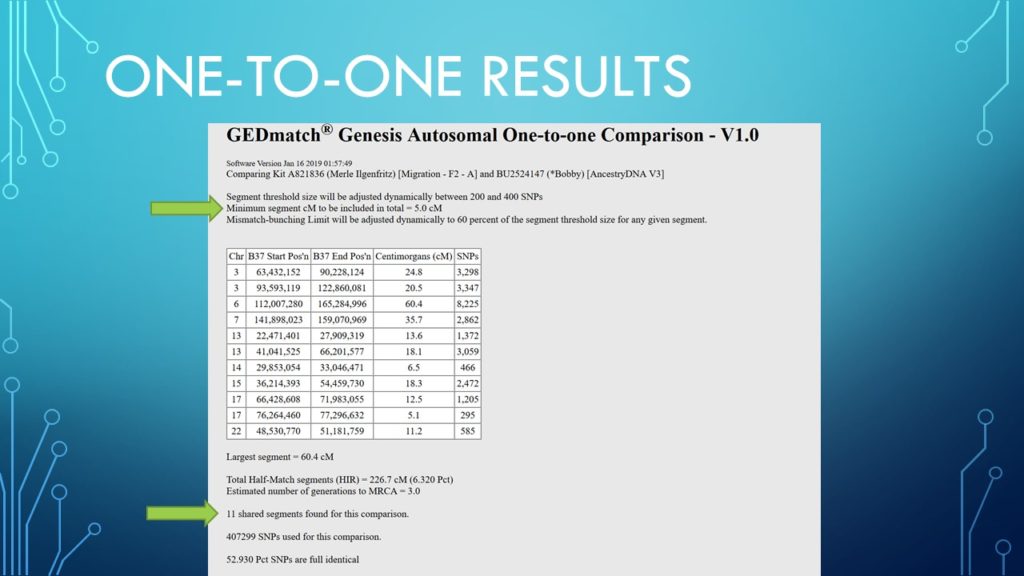
The output represents the segments of DNA that my 2nd cousin Bobby and I have in common that are 5 cM or larger.
Notice we have 11 segments in common:
- The first column shows what Chromosome the segment is on.
- The second column shows the Base Pair the segment starts on.
- The third column shows what Base Pair it ends on.
- The fourth column shows the total cMs of the segment.
- The fifth column shows the total SNPs of the segment.
Slide 39
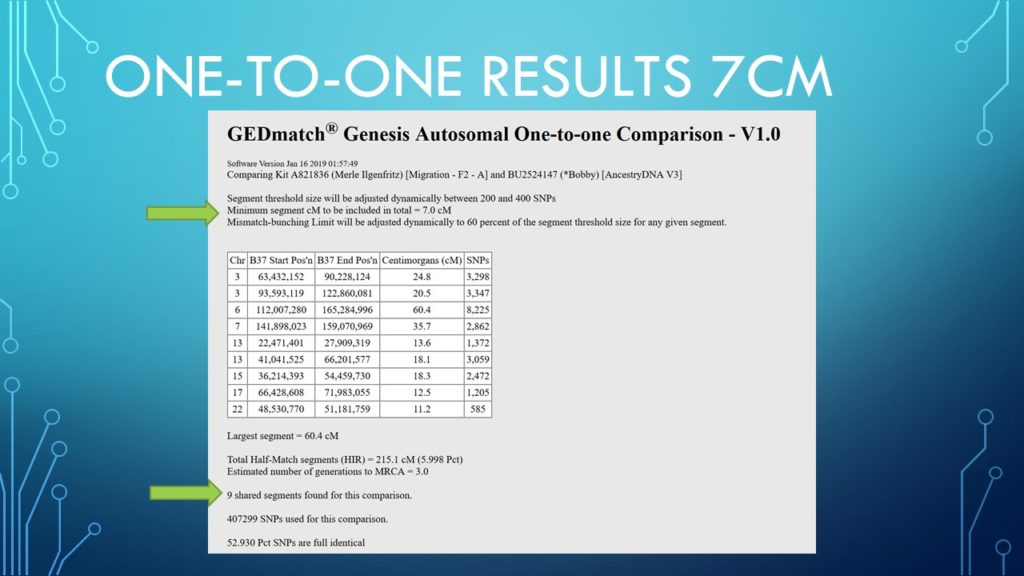
If I run the test with the default of 7 cM as the minimum segment size then I only get 9 segments. In this example on the previous slide I see that the the two additional segments were 5.1 and 6.5 cMs. So you have to decide if you want to include them in your data.
Once you have the table as listed in this example you need to copy the table into the DNA Painter site.
To do this click your left mouse button before the capital “C” in the top left box. Then hold the shift key down [don’t stop pressing it] and left mouse button click after the last number in the low right hand of the table. [[In this example it is after the last 5 in the cell will 585 in it]
Now the whole table should be highlighted. Stop pressing the shift key. Now press the ctrl key and the c at the same time. This will copy all of that info into your clipboard [which is your computer’s memory]. Now switchback to the DNA Painter site to paste the data in.
Slide 40
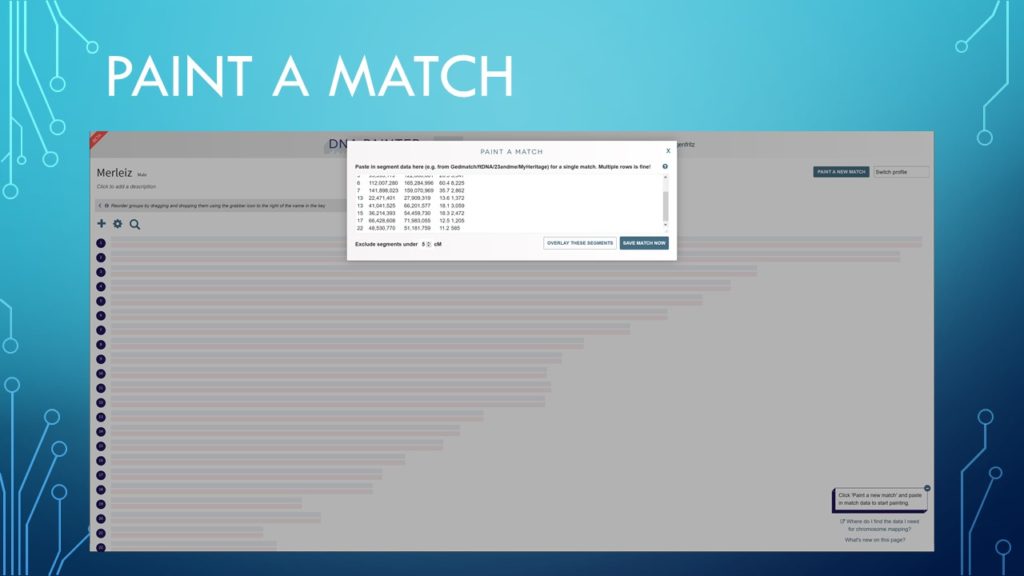
You will see in this example that the data was pasted into the Paint A Match box. To the left is a listing of all of the chromosomes and a bar representing your the DNA passed to you by each parent.
Think of those bars as being your DNA but you don’t know what ancestor each part came from.
Click on the Save Match Now button to save the data.
Slide 41
Now we can identify who the DNA segments came from. This is why you want to do all of the people you know on gedmatch first. Start from the top [omitting clase relatives] and work your way down.
If you don’t know anyone, contact the people at the top first and work down the list. If you are unable to figure out how you are related after they respond to you then moved down the list to the next person.
The goal is to paint all the matches that you know about first. This way if you check anyone you don’t know then maybe they too will have a shared segment that you have identified.
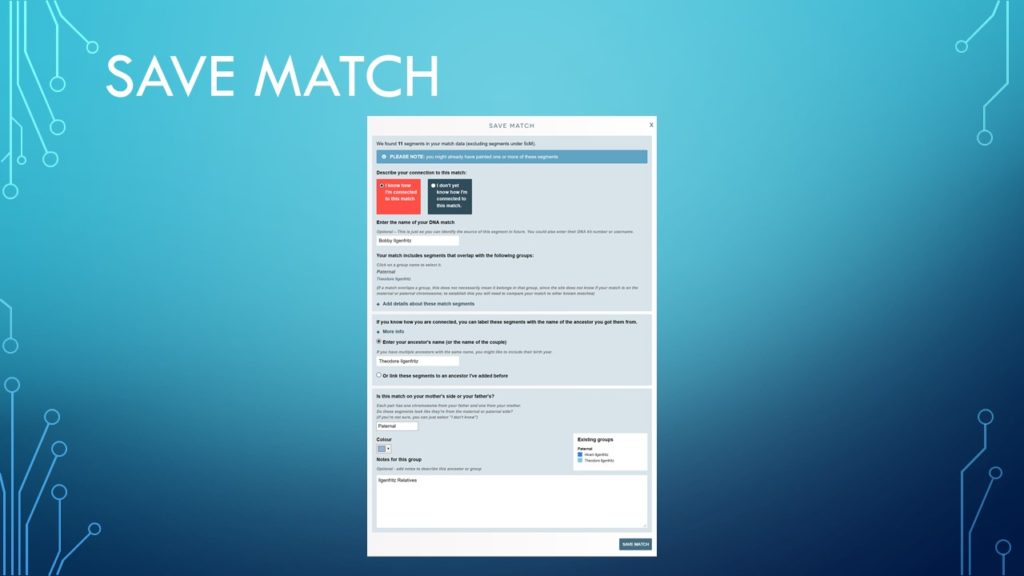
Since I know how this person is related to me I will click on the top left radio button. Then I will enter their name.
Since Bobby and I share common great grandparents I can not know which segment came from my great grandmother or great grandfather. So I will identify these segments coming from their child that I am related to. That would be my paternal grandfather.
Below that I will add that persons name. Since I know we are related through my father’s side of the family I will set it for Paternal. I will set a color for this person and add a note below that.
Now I will click on the Save Match button.
Slide 42
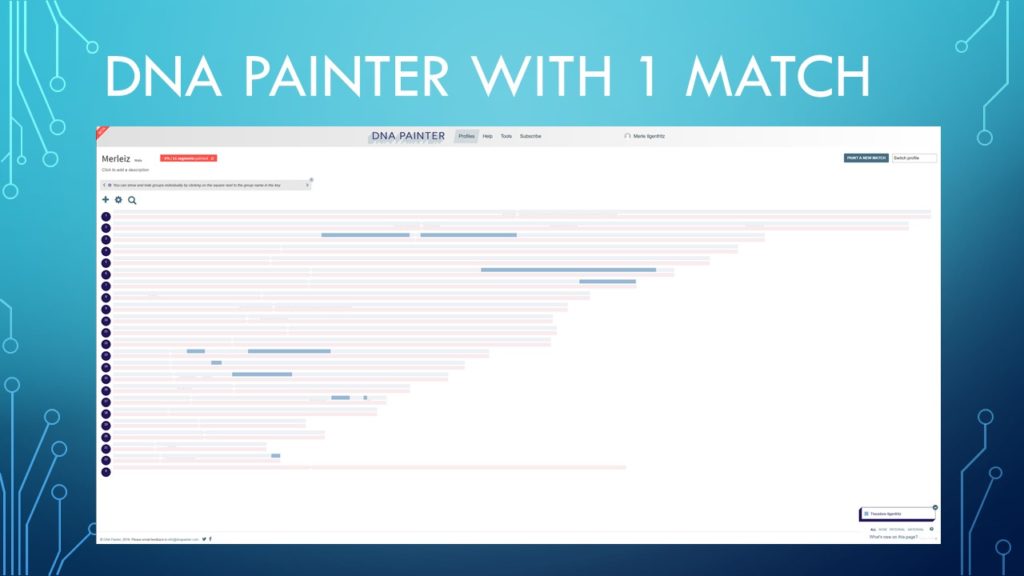
Now you can see in the slide that the segments I have in common with my second cousin are “painted into my chromosome browser.
Slide 43

So the next person on the one-to-many list for me is a second cousin 1X removed. She also has the same great grandparents in common with me. So I click on the 1:1 link and copy her table into the painter. [same steps as shown on earlier slides]
Slide 44
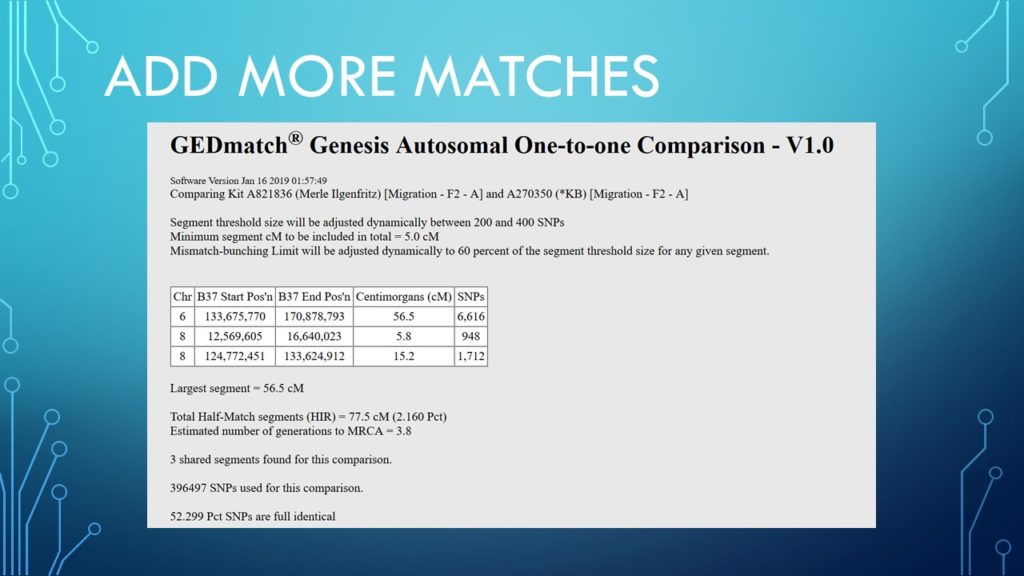
Here is her table. So I will copy it and paste it as a new match.
Slide 45
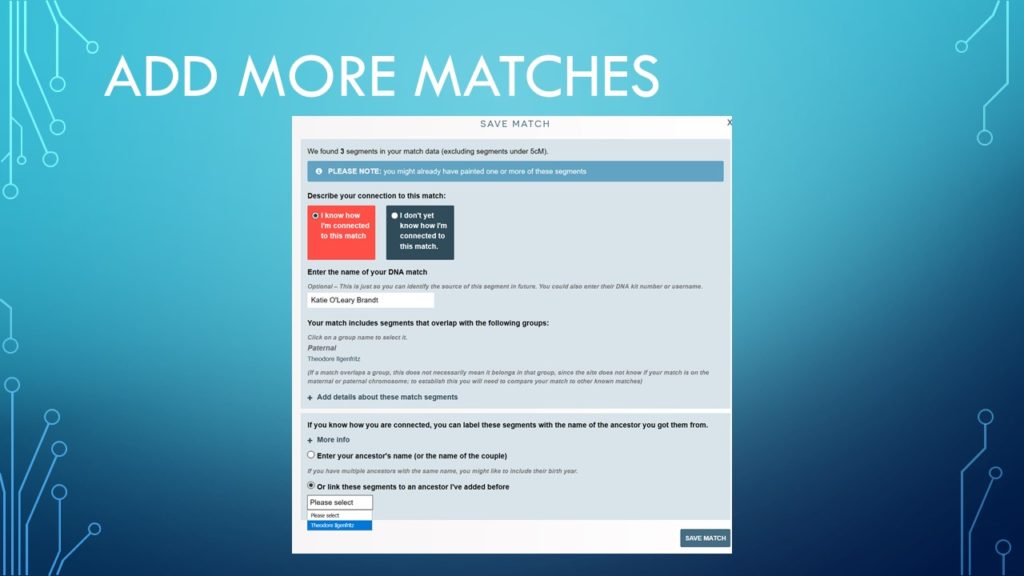
The main difference on this step is that since I already have my grandfather listed I will select the radio button on the bottom to select someone already added and select my grandfather from the drop down menu and then save the match.
Slide 46
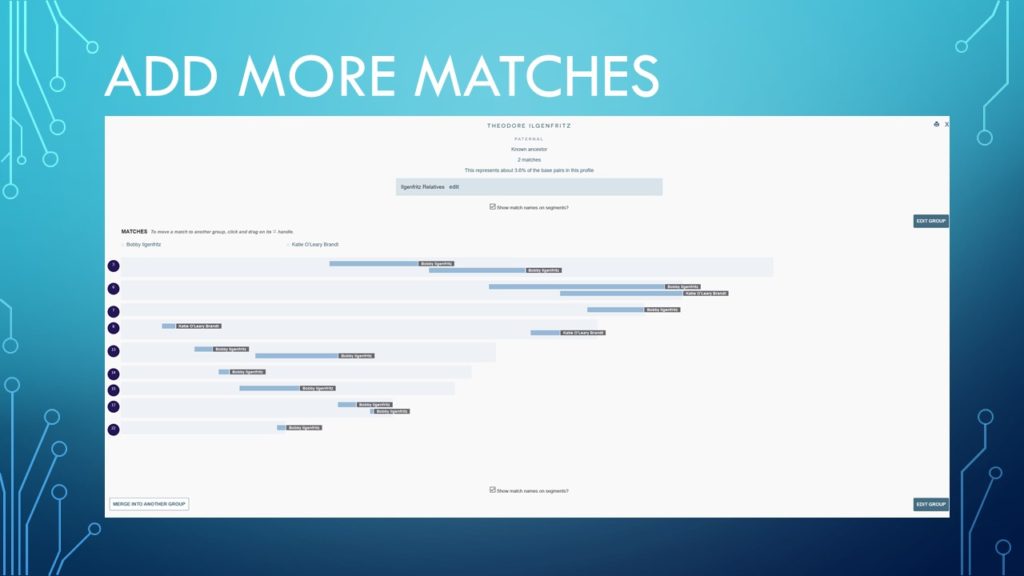
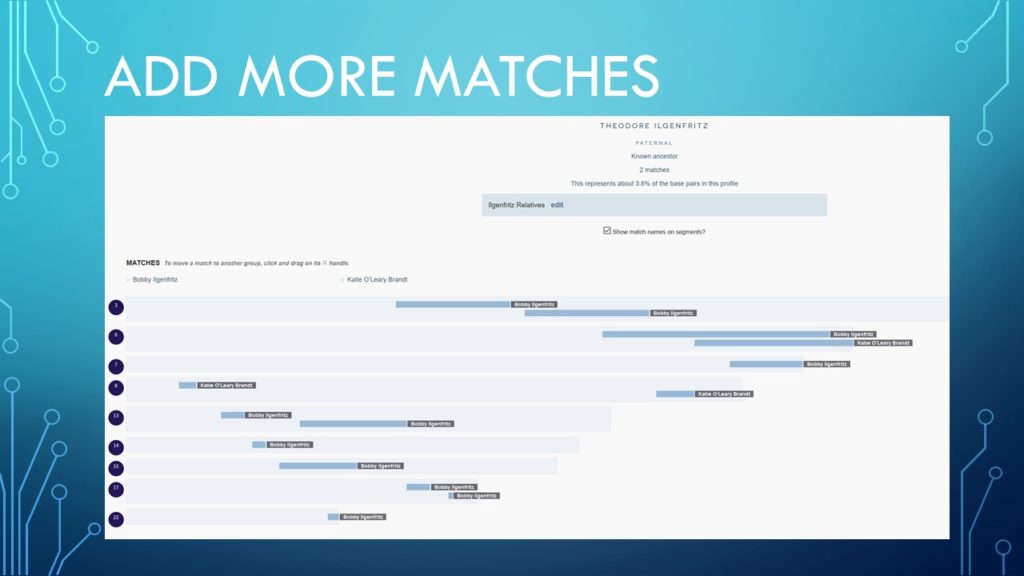
When I click on my grandfather in the lower right of the screen I will see all of the people that I match to that I got our common DNA from him.
Notice in the example at the top that these to samples represent 3.6% of my DNA has been identified. So as you add more matches that number will rise.
I clicked on the check mark next to Show match names on segments? to show which segment came from each of them.
Also notice that it filters out the rest of the chromosomes that you don’t share any matching segments on.
Slide 47
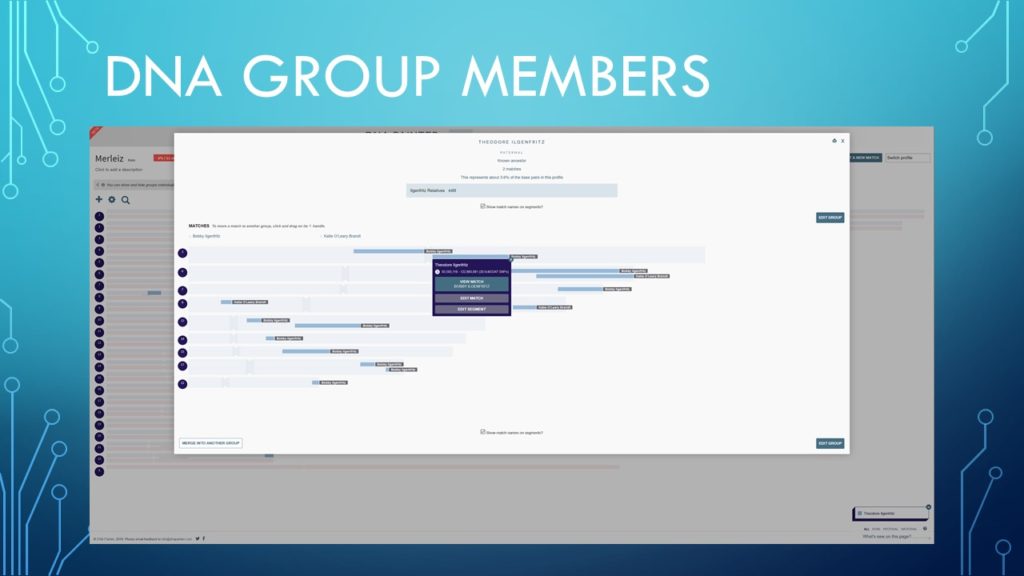
If you click on a segment then you will see the starting and ending Base Pair for the segment.
Slide 48

Notice on Chromosome 6 that I share common DNA with the three of them starting with the beginning of Katie’s segment and ending at the end of Bobby’s segment. That segment is proof of Autosomal Triangulation.
Slide 49
When three people have the same DNA segment and the same ancestor then you have autosomal triangulation.
Slide 50
When you triangulate you first determine what is the MCRA for all of the people that share that segment. Then you identify their child that you are related to.
For instance: if you and 2 cousins all share your great grandparents as common ancestors then you can not be sure which of your great grandparents the segment came from. But you do know in order for you to get that segment that your grandparent who was their child passed the segment to your parent and then to you.
Slide 51
Both Bobby and Katie go through my grandfather’s brother Jerome to get to our common ancestor.
Slide 52
So I will continue the process and add another person. They are my 3rd cousin. Our common ancestor is our 2nd great grandparents. So I go through the steps shown on the previous slides and add his data and save the match.
We share just one segment near the beginning of Chromosome 20.
Slide 53
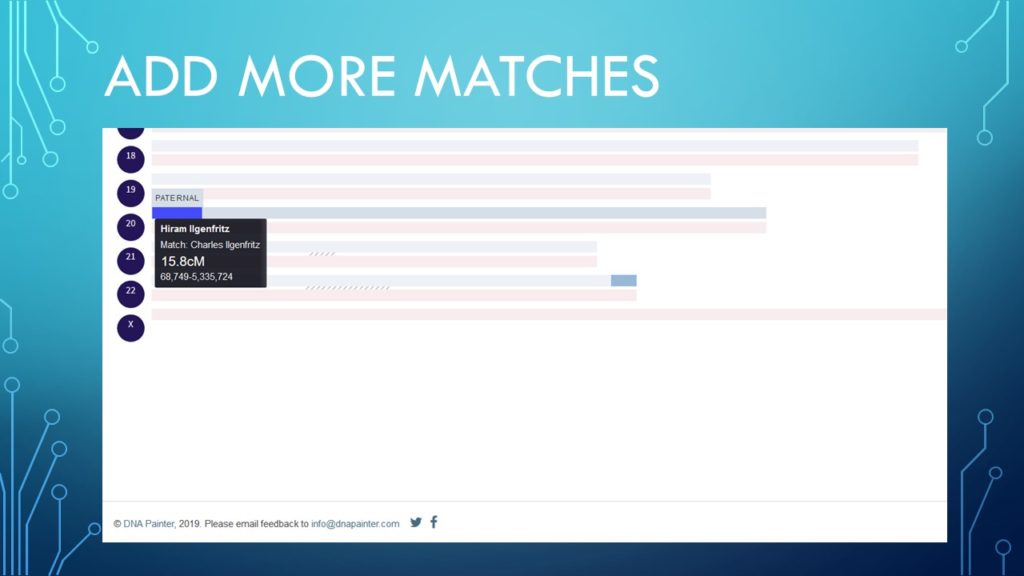
If I click on his segment I can see more details about it.
Slide 54
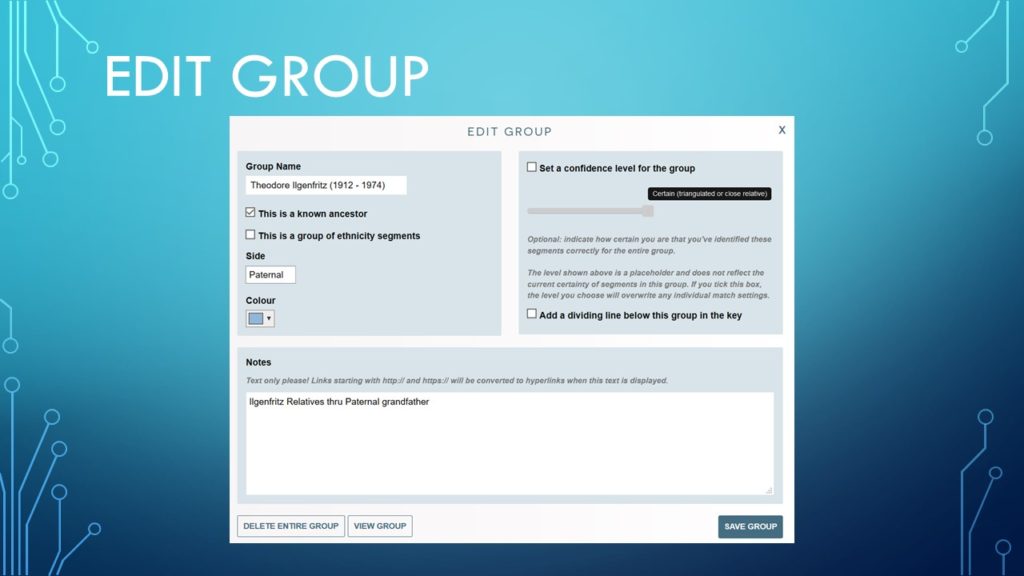
I realized as I keep adding additional ancestors some of them have the same name. So I went back and edited the groups and added a birth and death year.
On the right side of this Edit Group screen I changed the confidence level to the highest rating. I also edited my notes. Then I saved my changes.
Slide 55
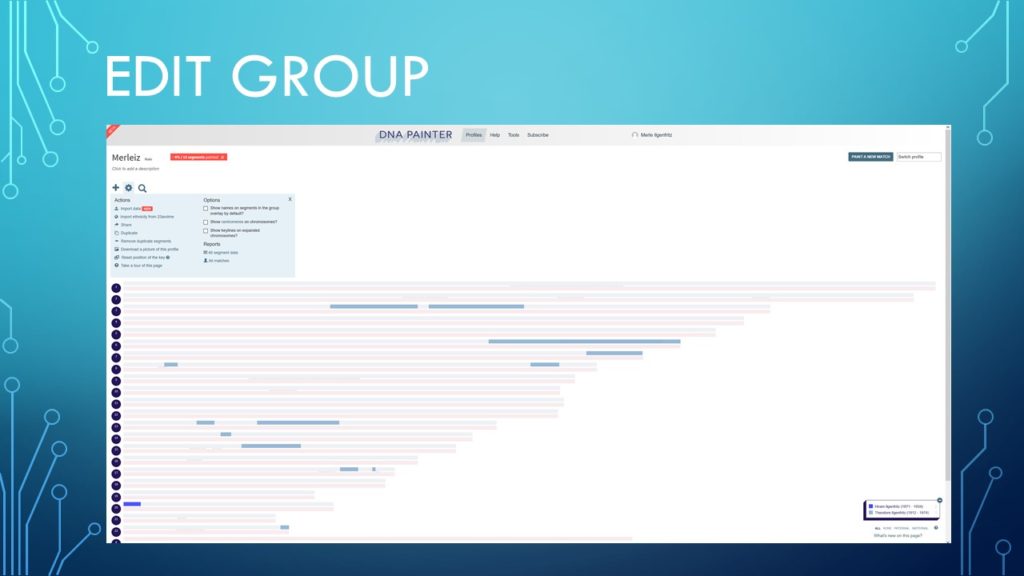
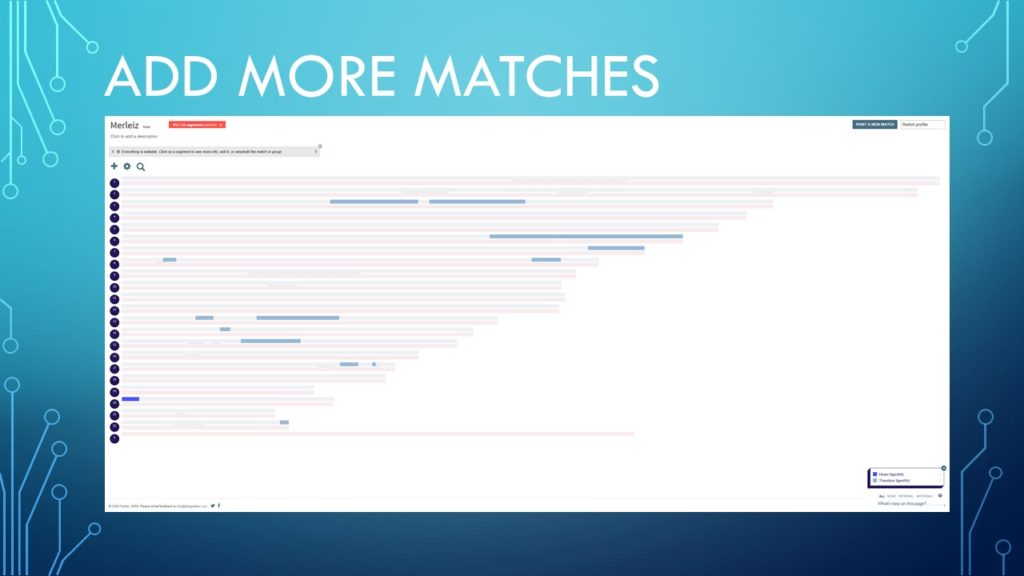
Notice on the bottom right the key has been updated for both ancestors.
Also notice I clicked on the “tools” icon on the top left.
Slide 56
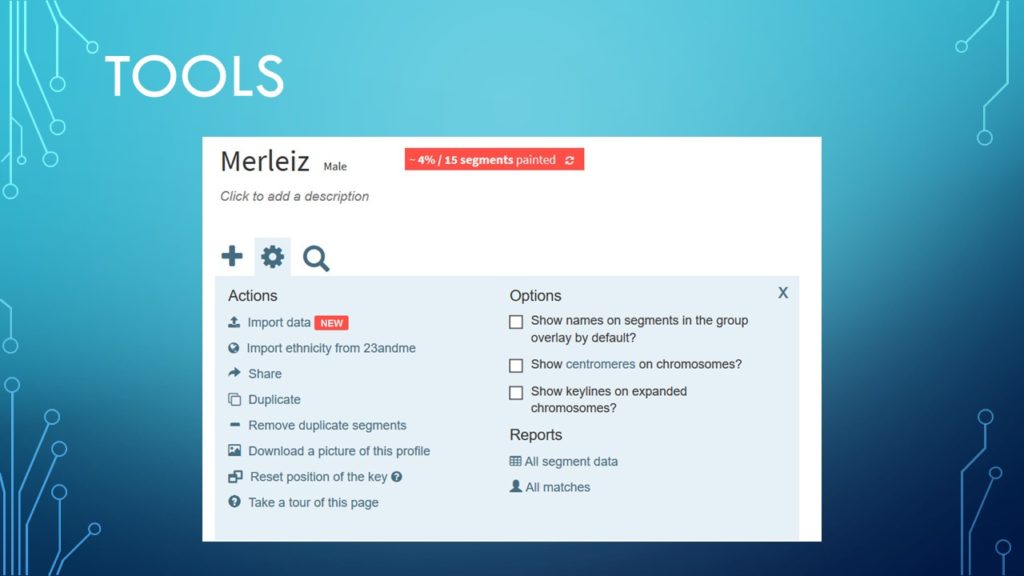
One of the useful tools is that you can show All segment data.
Slide 57
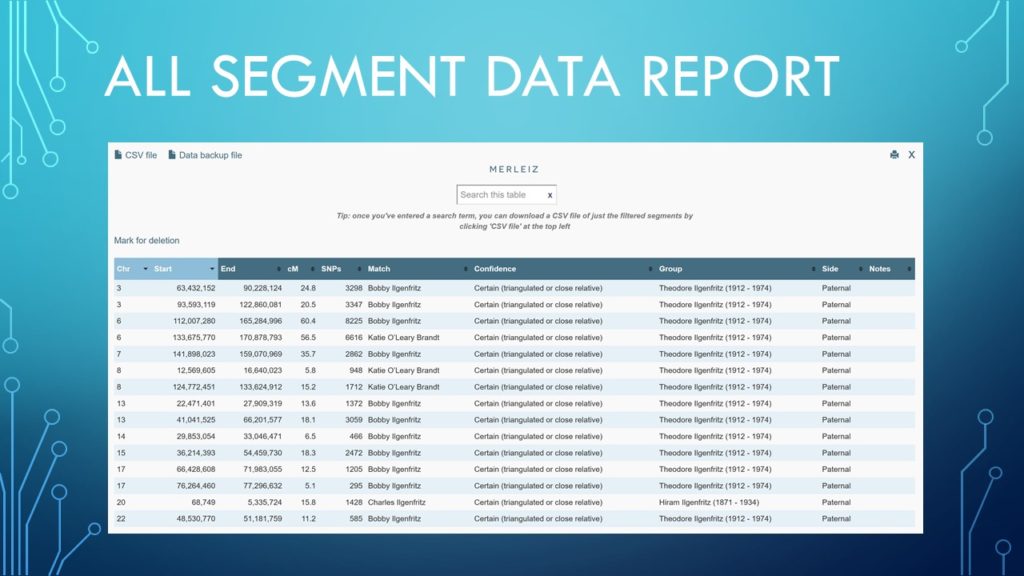
This represents data for all the segments I have added. You can save this as a CSV (Comma Separated Value) file.
That will allow you to open the file in Excel or some other spreadsheet program.
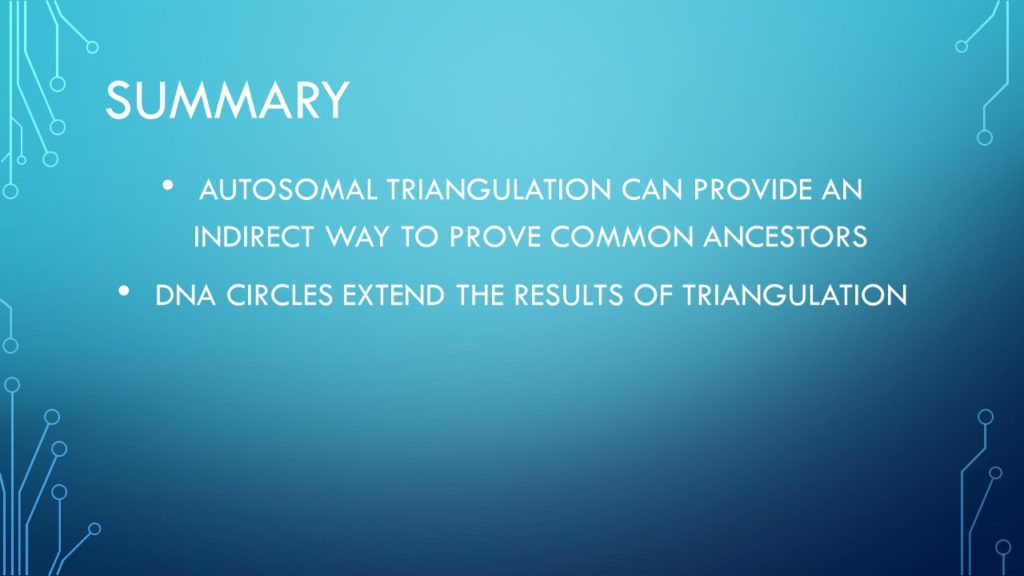
Slide 58
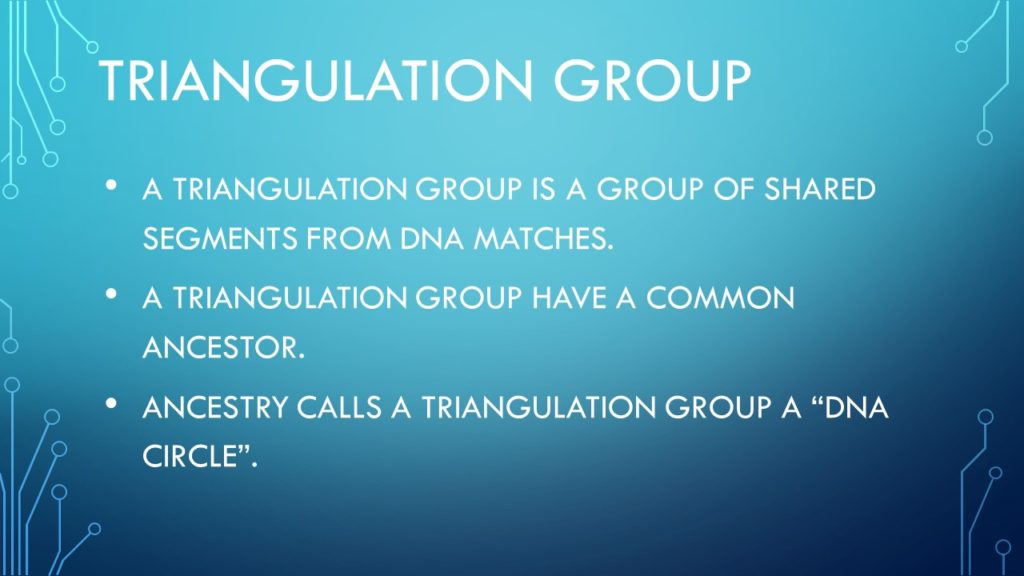
When we have three people with a common DNA segment we have Autosomal triangulation. Those three people might have common segments with other people as well but not the same segment.
All the people share the same common ancestor. Ancestry groups all of these people in a “DNA Circle”.
Click on the DNA Tab to see the DNA services.
Ancestry only provides Autosomal DNA services. You can get more information about their testing services HERE.
Slide 59
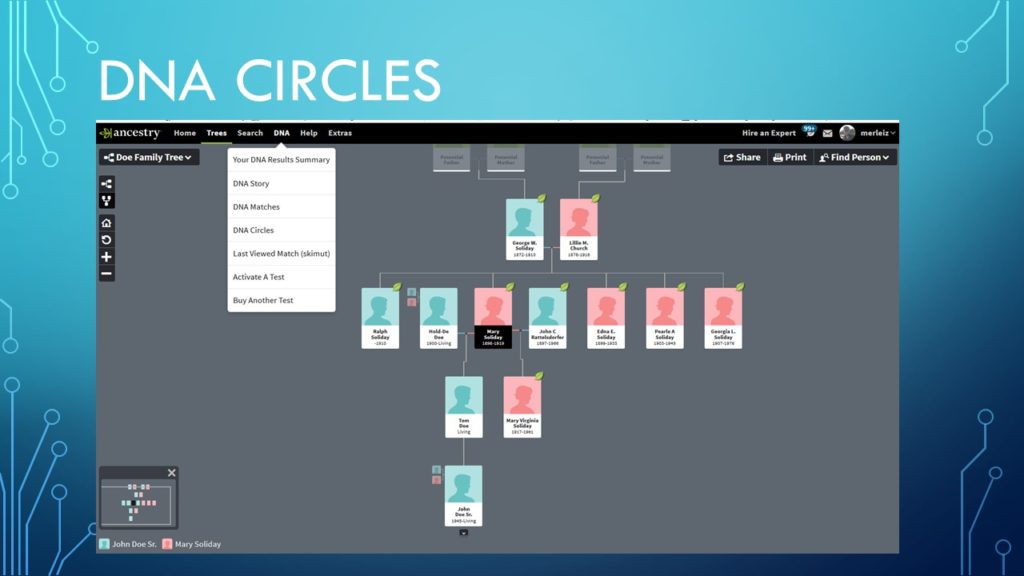
From the drop down menu select DNA Circles. If you don’t have any after you get your DNA sample results, give it some time. Ancestry has to compare your sample and tree to others in order to make a match.
Slide 60
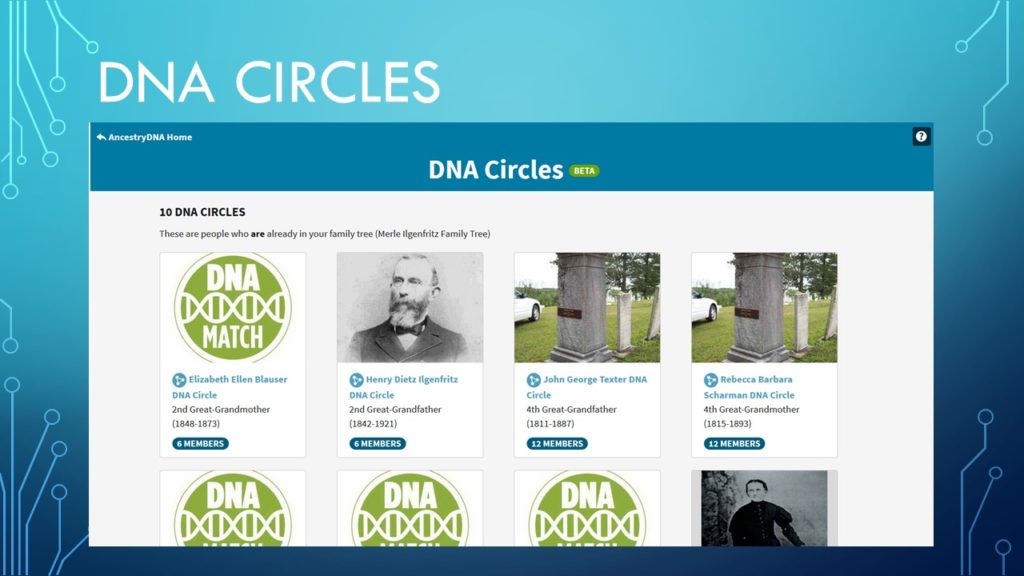
I have multiple DNA Circles. The images on each circle come from my tree.
If I don’t have any images for that ancestor I is this DNA Match image. Click HERE to get the image to use in your tree.
I add the image as a birth record image. It alerts me that this person is proven using DNA.
Slide 61
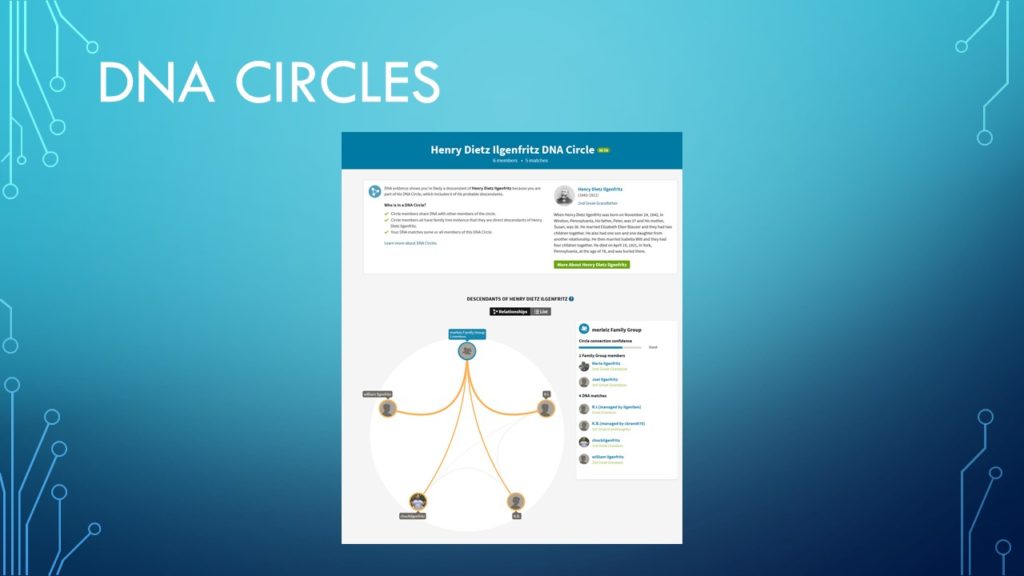
When you go to a specific DNA Circle in ancestry you will see a screen like this one.
Slide 62
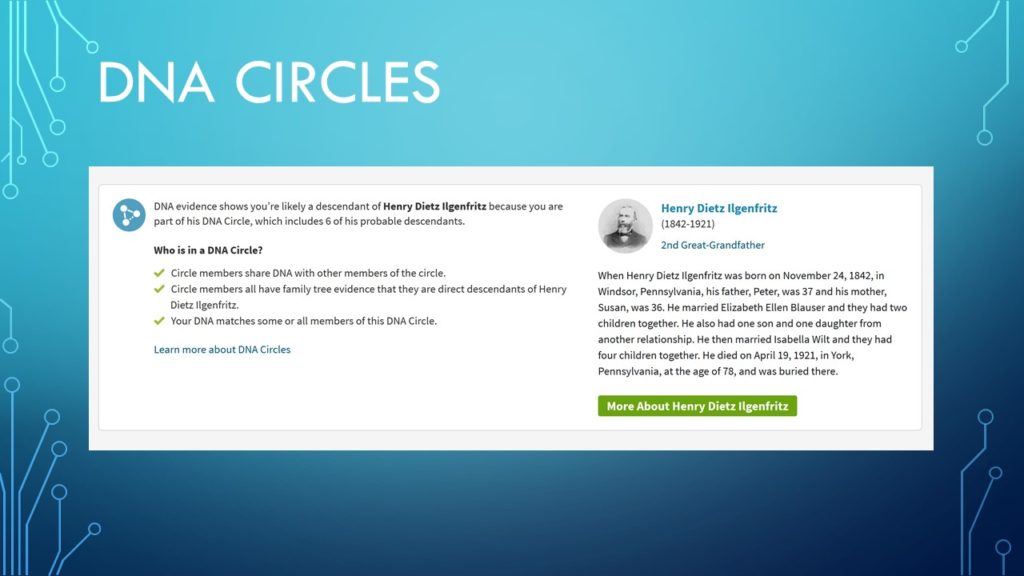
At the top is some info on what a DNA circle is and info on the common ancestor. This information comes directly from your tree. The green button will take you to that person’s page in your tree if you click on it.
Slide 63
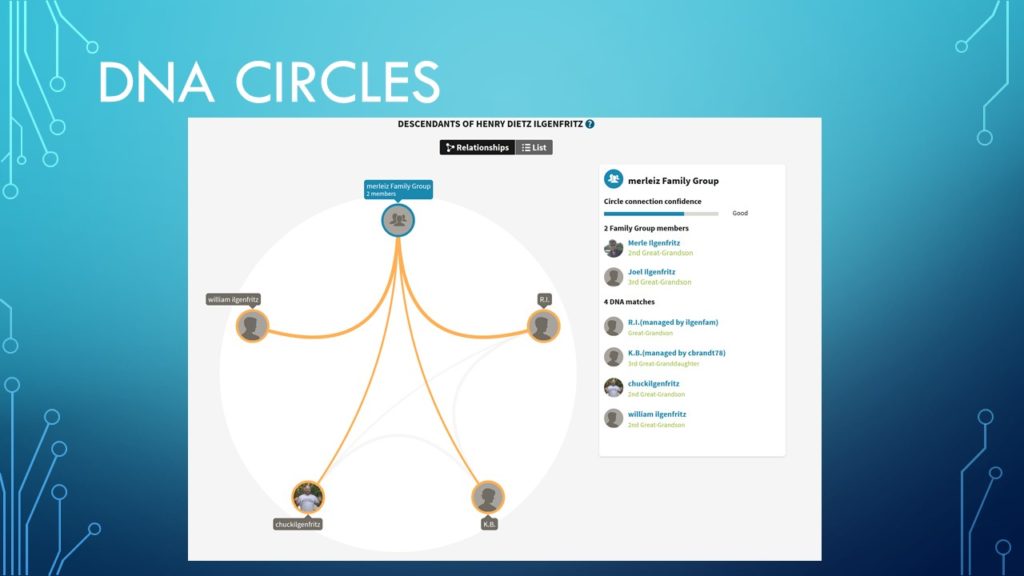
The bottom of the screen shows the actual circle. You can see I am in a family group because my son Joel also did his DNA. I also can see that we have common DNA with all of the other people in this circle.
Slide 64
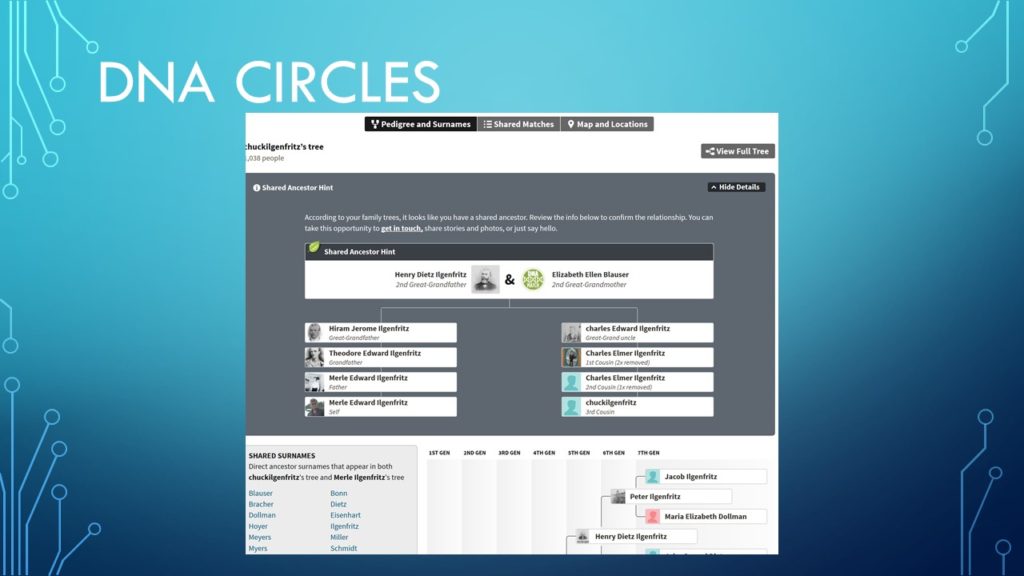
You can click on someone and discover how you are related. Remember both you and this relative have to have the common ancestor in your trees.
Slide 65
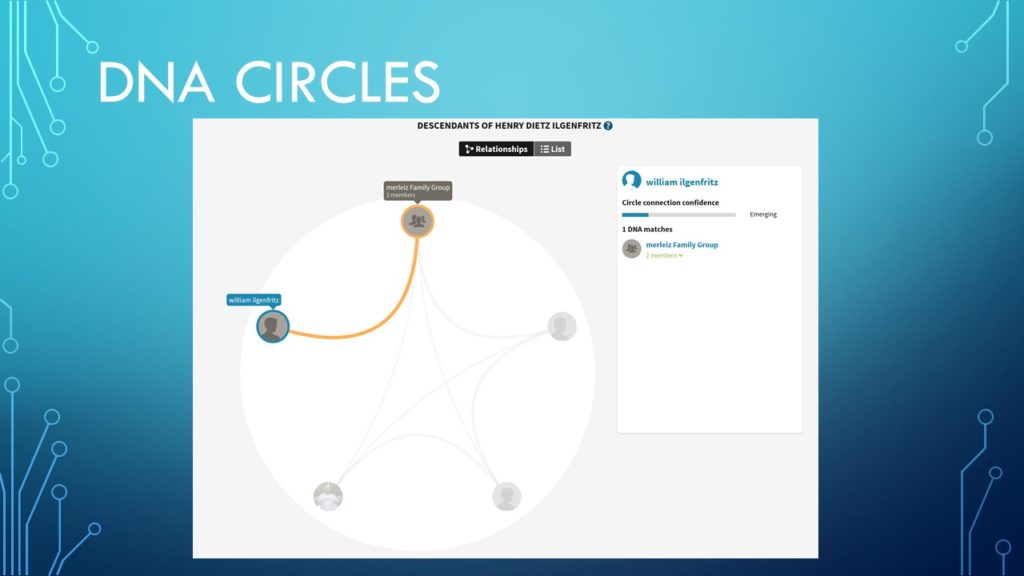
Notice however that one relative is only matched to me in this circle. We have a common DNA segment and the same common ancestor as the others. But he says no common DNA with them.
That is the power of DNA circles. He would not be able to connect to them without the circle!
Slide 66
So what do you do when you come across someone you don’t know. In my list the first one was Franjka. We have 36.3 cMs in common. I don’t know if they are on my father or mother’s side of the family.
Luckily my mother did her DNA (my father passed away.) So her is a technique that can possibly help you figure out what side of the family they are on.
But first EMAIL them! (which I did right after taking this screen shot).
Slide 67
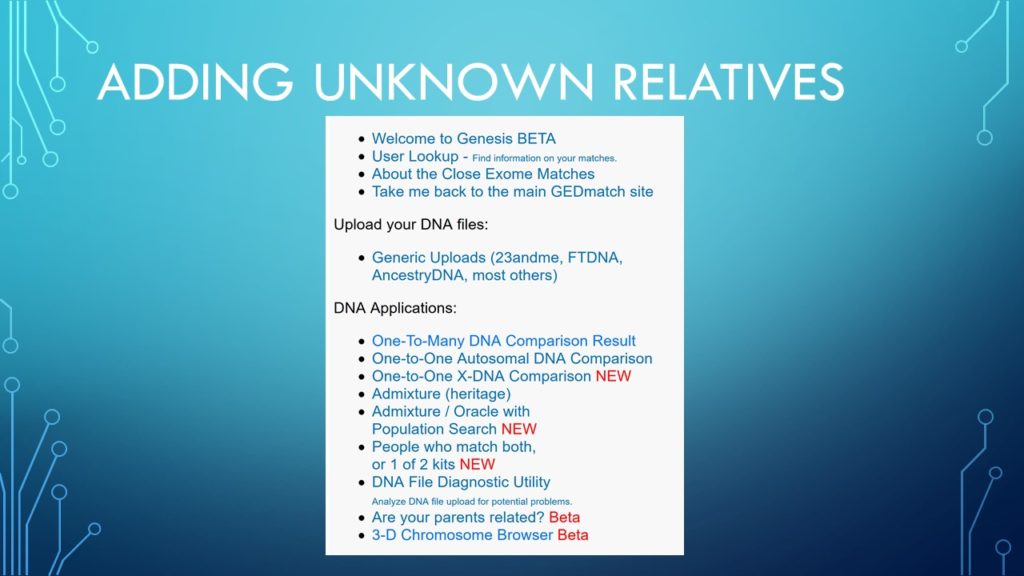
GEDMatch has a tool called the 3-D Chromosome Browser – so I clicked on it.
Slide 68
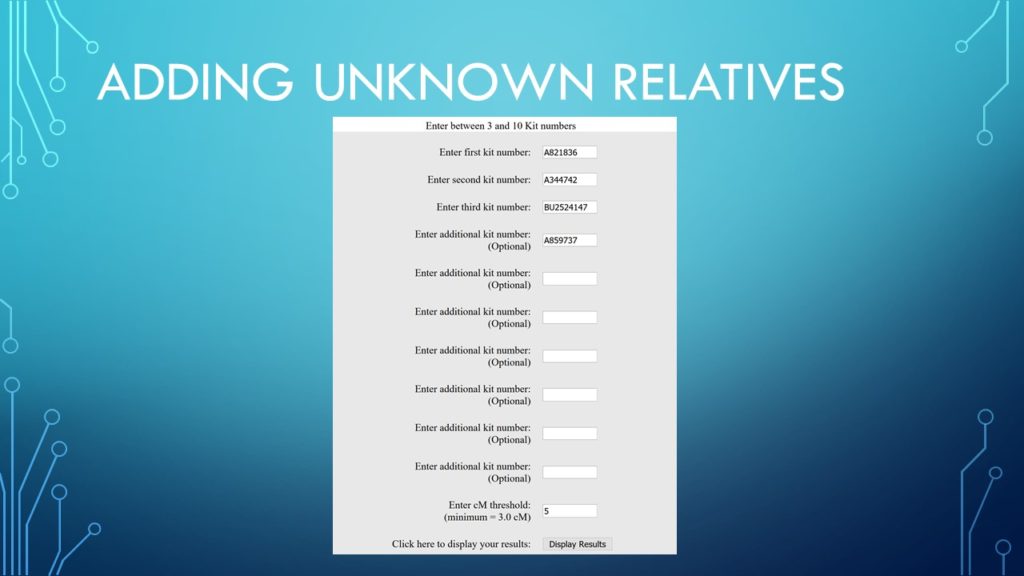
I then added my ID, my mother’s ID and my 2nd cousin’s ID so that I would have the closest relative on each side. Lastly I added Franjka and clicked on Display Results.
Slide 69
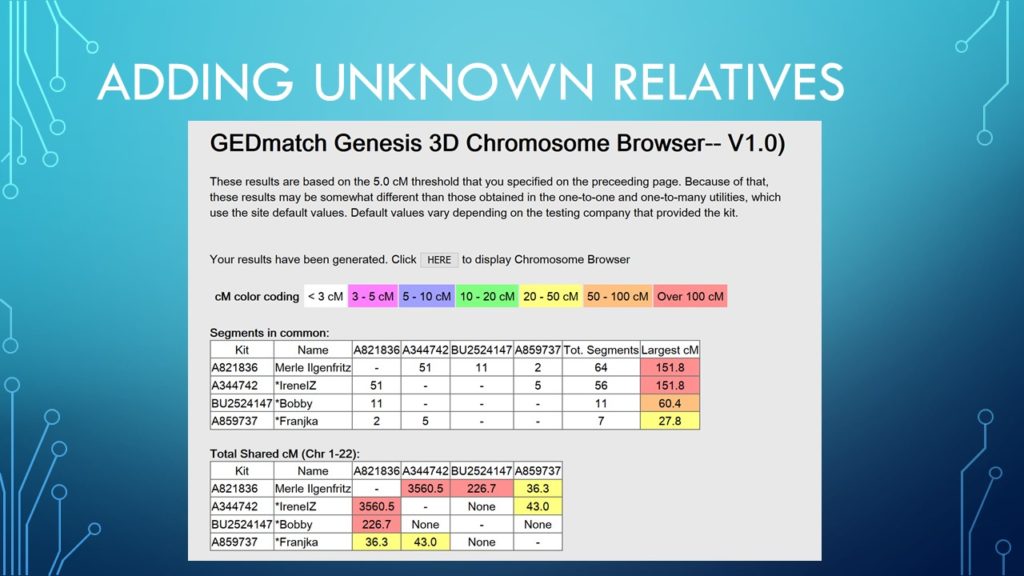
Look at the info you get! I can see that in the second table that Franjka has common DNA with my mother but not my 2nd cousin Bobby. Not more than a minute after taking this screenshot I got a response email from the person who upload her DNA. Gary is also related to Franjka but he is not sure how. She lives in Croatia and doesn’t speak English. I asked him what was her last name. He said Rukovina. My great Aunt on my mother’s side listed her mother’s maiden name as Krovina on her immigration record. Could it really be Rukovina?
Go back to Slide 66 and look at the last column for Franjka. See where it shows 4.3 generations? GEDMatch tries to determine how far back your common ancestor would be.
Notice both my mother and son are 1.0 generations. My uncle Paul is 1.5. So he is not my parent or my child. Thus 1.5.
Franjka is 4.3 so closer to 4 (2nd great grandparents) than to 5 (3rd great grandparents) generations ago. That will help me to determine how far we need to go back to find our common ancestors. Since I know who my great grandmother was, my guess is that it is her parents that Franjka and I will have in common. Hopefully she will have more info on them.
Gary is going to Croatia this summer to find out! Stay tuned!
Slide 70
I hope that this presentation has cleared up for you (in a general way) how autosomal DNA works, what the test can do for you and how to use some online tools to aid you in your family tree research.
At the very least you will find thousands of new family members to share info with.
If you have any questions or comments – please email me at: merleiz@yahoo.com
Slide 71
The next lecture will focus on y-DNA testing. How does it work and what kind of information can we get from the results when comparing with others.
Slide 72
Link to other presentations HERE
Slide 73
End of Presentation